Single run of TimeXNet from User Interface
TimeXNet can also be run via a user interface for a single combination of gamma1 and gamma2 values. The user interface can be invoked by double-clicking timexnet.jar or using the following command:
java –classpath [full installation directory]/timexnet.jar timexnet.NetGUI
It is necessary to specify the fully qualified path where the jar file is installed in order to run TimeXNet.
User Interface
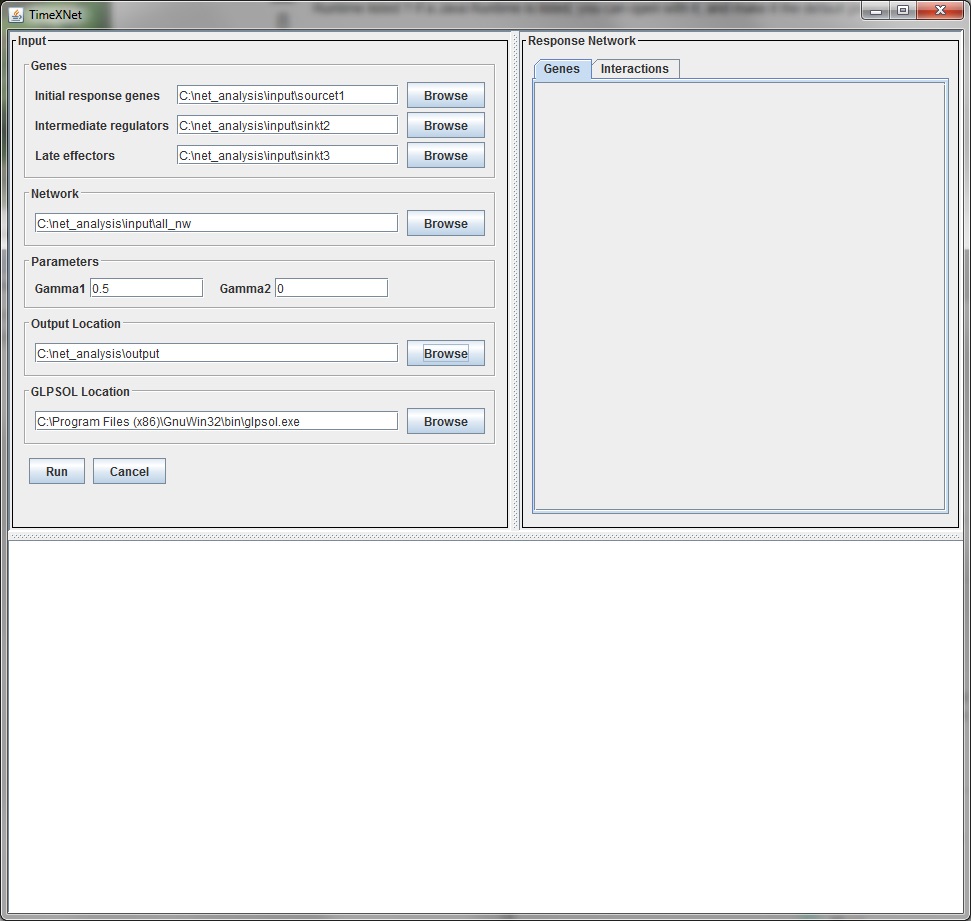
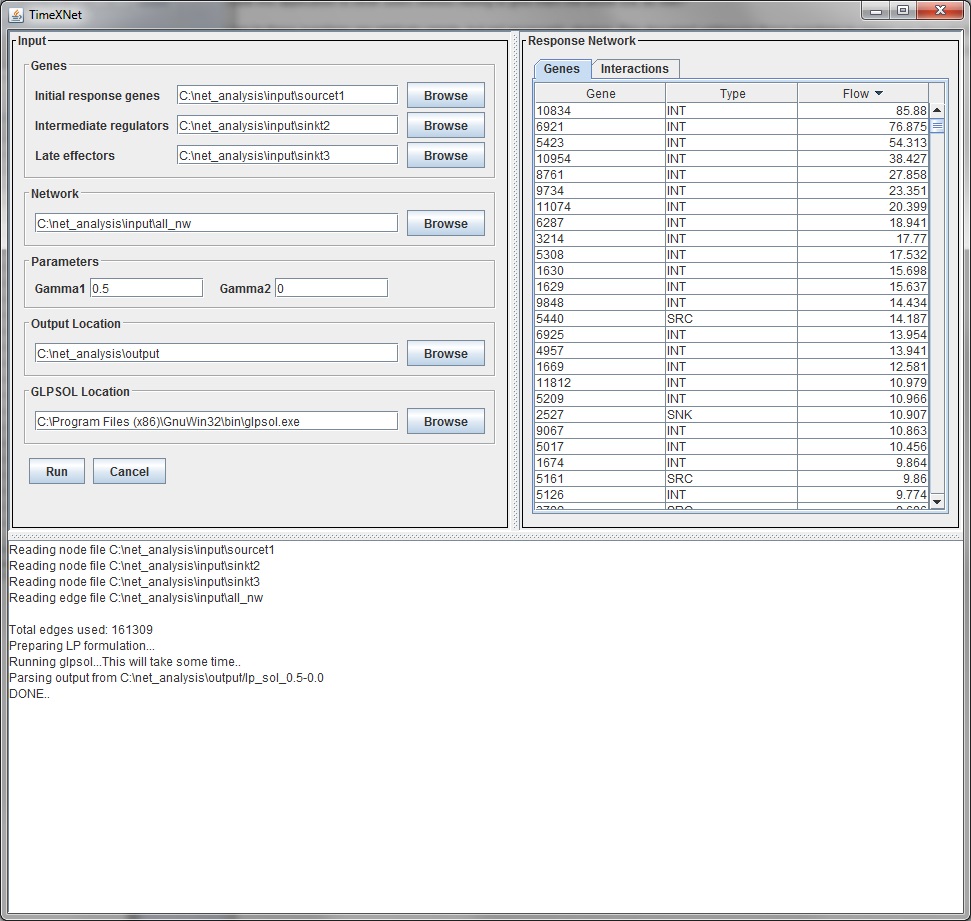
The Upper left pane is used for the input arguments. The lower pane displays the progress of TimeXNet. The tabbed pane on the right hand side shows two tables with the genes and edges predicted to be a part of the response network along with their flow values.

Input parameters
The input parameters are the same those when run on the command line.
- Input network: A list of interactions with their directionality and their reliability score in the format:
- Molecules 1 and 2 can be an Id or a name.
- The direction of the interaction can be either "--" (bidirectional interaction) or "->" (uni-directional interaction).
- The reliability score is between 0 and 1.
- This data is currently provided in the form of a tab-delimited flat file.
- Initial gene list: A list of the genes of interest showing their greatest change in expression in the early hours after stimulation along with their scores in the format:
- Molecule can be an ID or name. The node identifier used here is the same as that used in the interactions file above.
- The score can be any positive real number that indicates the amount of change in expression of the gene.
- This data is also provided in the form of a tab-delimited flat-file.
- Intermediate gene list: A list of the genes of interest showing their greatest change in expression in the intermediate hours after stimulation along with their scores in the format specified above.
- Late gene list: A list of the genes of interest showing their greatest change in expression in the late hours after stimulation along with their scores in the format specified above.
- Gamma1: A positive real value that controls the number of Initial genes included in the predicted network. A larger value results in inclusion of more Initial genes.
- Gamma2: A positive real value that controls the number of Intermediate genes included in the predicted network. A larger value results in inclusion of more Intermediate genes.
- GLPSOL location: The fully qualified path to the GNU executable GLPSOL (including the name of the executable) used to solved the optimization problem eg. "c:\\Program Files (x86)\\GnuWin32\\bin\\glpsol.exe". TimeXNet carries a bundled copy of GLPK and prompts the user to install it if not installed already.
- Output directory: Fully qualified path of the location where the output files should be stored.
"Molecule1[TAB]Molecule2[TAB]Direction[TAB]Reliability"
The molecule name should be the same as in the gene lists.
"Molecule[TAB]Score"
Output
The lower pane displays the progress of TimeXNet. The tabbed pane on the right hand side shows two tables with the genes and edges predicted to be a part of the response network along with their flow values.

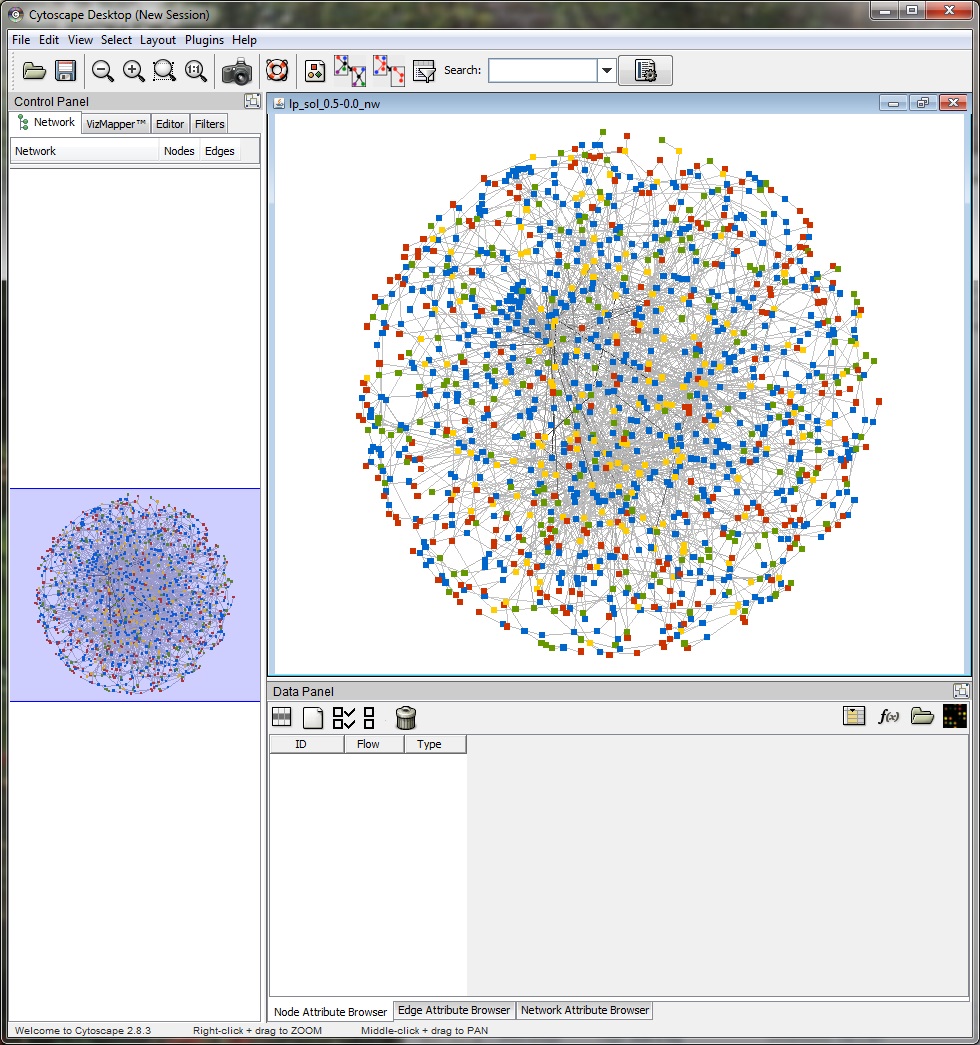
The "View Network" button allows the user to view the predicted response network in Cytoscape. TimeXNet invokes a bundled copy of Cytoscape 2.8.3 and does not require the user to install it on the user's machine.

The network nodes (genes) are color coded as follows: Red -initial response genes, Yellow -intermediate regulator, Green - late effector, Blue - predicted regulator.
TimeXNet also generates the following output files:
- lp_form_g1-g2: The problem formulation in the format required by glpsol
- lp_sol_g1-g2: The output file generated by glpsol that contains the solution to the optimization problem
- lp_sol_g1-g2.edges: The list of interactions with their flows parsed from the glpsol output file. The format is as follows:
- lp_sol_g1-g2.nodes: The list of nodes in the network in (3) with their associated flows, calculated by adding all the incoming flows per node. The format of this file is as follows:
- log_g1-g2: Log file showing the detailed progress of the TimeXNet run including the duplicate edges identified and ignored, edges and nodes with erroneous weights and scores, and the detailed output of the glpsol program.
- edge_lst_g1-g2: List of edges used to run the final cost flow optimization problem. This file represents the final input network. >
- Additional filesTimeXNet also generates node and egde attribute files along with a .sif file representing the network that can by uploaded into Cytoscape.
"Molecule1~Molecule2[TAB]Type[TAB]Flow"
Here "Type" can be one of "pp" or "pd" indicating a bi-directional or uni-directional interaction, respectively. This file is in a tab-delimited format and can be directly uploaded to Cytoscape to visualize the network.
"Molecule[TAB]Type[TAB]Flow"
In this case, Type can be one of SRC (initial genes), INT (intermediate genes), SNK2 (late genes) or NOD (predicted gene showing no change in expression). This file is also in a tab-delimited format and can be uploaded into Cytoscape.