TimeXNet Web interface
Input
In order to run TimeXNet from the web interface, the following input parameters are required:
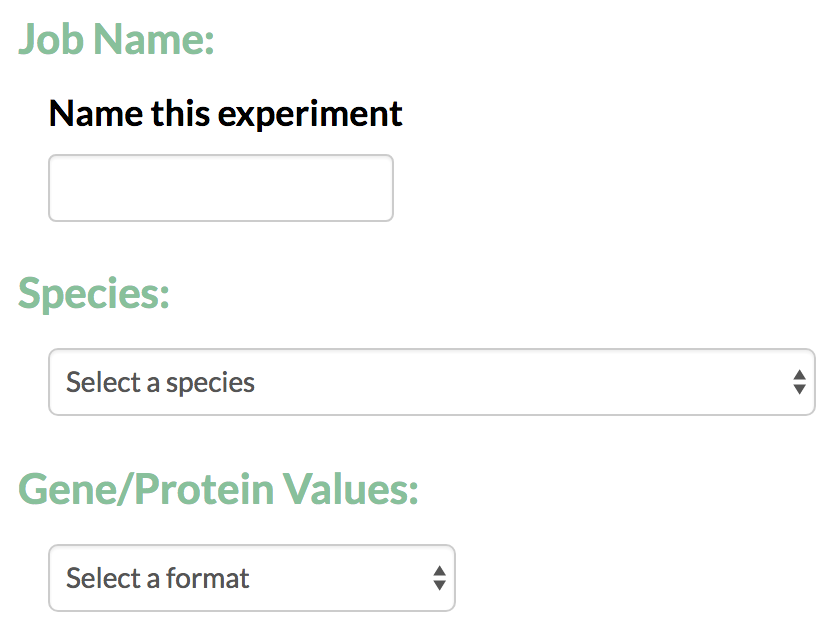
- Job Name: For every run the user is required to give a job name that can later be used to identify the TimeXNet analysis run.
- Species: The user is required to specify the species for the which the analysis will be conducted. This helps TimeXNet to interconvert gene/protein identifiers between multiple formats.
- Gene/Protein Values: TimeXNet accepts gene identifiers in multiple formats and performs an interconversion between formats when necessary.
4. Input values: The TimeXNet algorithm tries to connects of genes/proteins showing large changes at consecutive time points within an interaction network. The current version of TimeXNet works with three groups of genes – early, intermediate and late – based on their time of maximum fold change. TimeXNet allows the user to give the active gene set in the form of a matrix of fold change values or pre-calculated time-based groups. The genes/proteins can be specified in one of the following 3 formats:
A) Matrix file: A matrix of genes/proteins and their log fold changes in expression, protein levels or phosphorylation levels over time can be given to TimeXNet in a tab-delimited flat file in the following format:
"Molecule[TAB]Time1-LogFC[TAB]Time2-LogFC[TAB]Time3-LogFC…."
Molecule can be an ID or name. The subsequent columns give the log fold change value of the gene or protein with respect to control at the specified time. TimeXNet internally identifies the early, intermediate and late groups of genes.
The user also needs to specify if TimeXNet should use only up or down-regulated genes or both to calculate the activate gene networks.
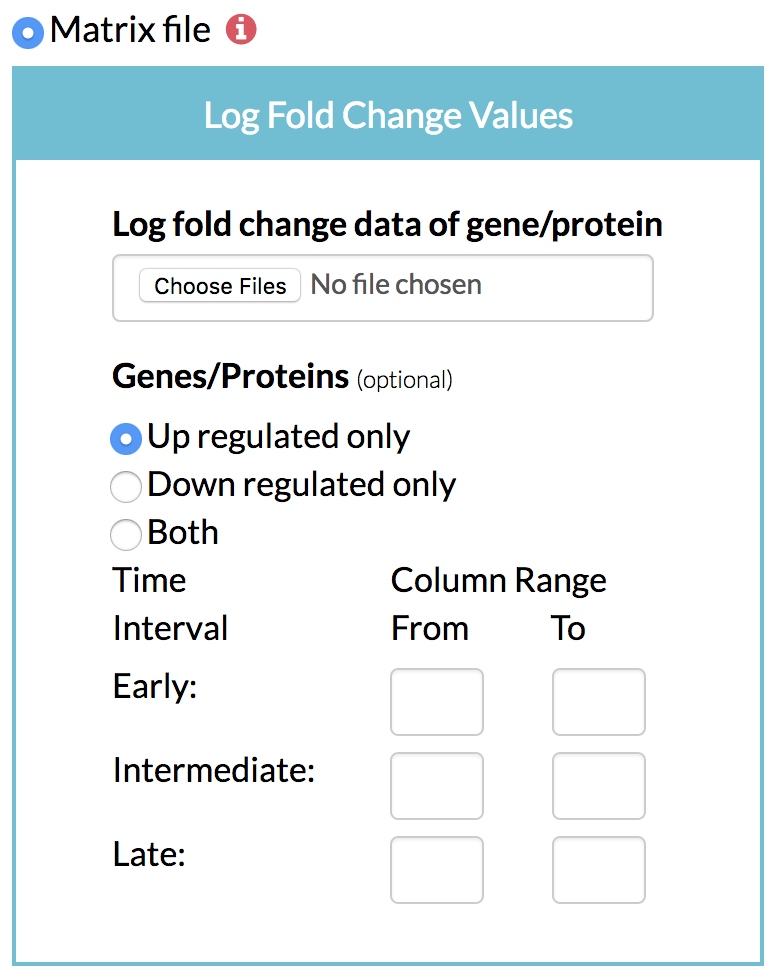
B) Optionally, the user can specify the grouping of early, intermediate and late time points by giving the column numbers. For instance, columns 1-3 could be used to identify source genes, column 4-4 could be used to identify intermediate genes, and columns 5-6 could be used to find the late Three files: Three groups of genes grouped based on their time of maximum change, each in a separate file.
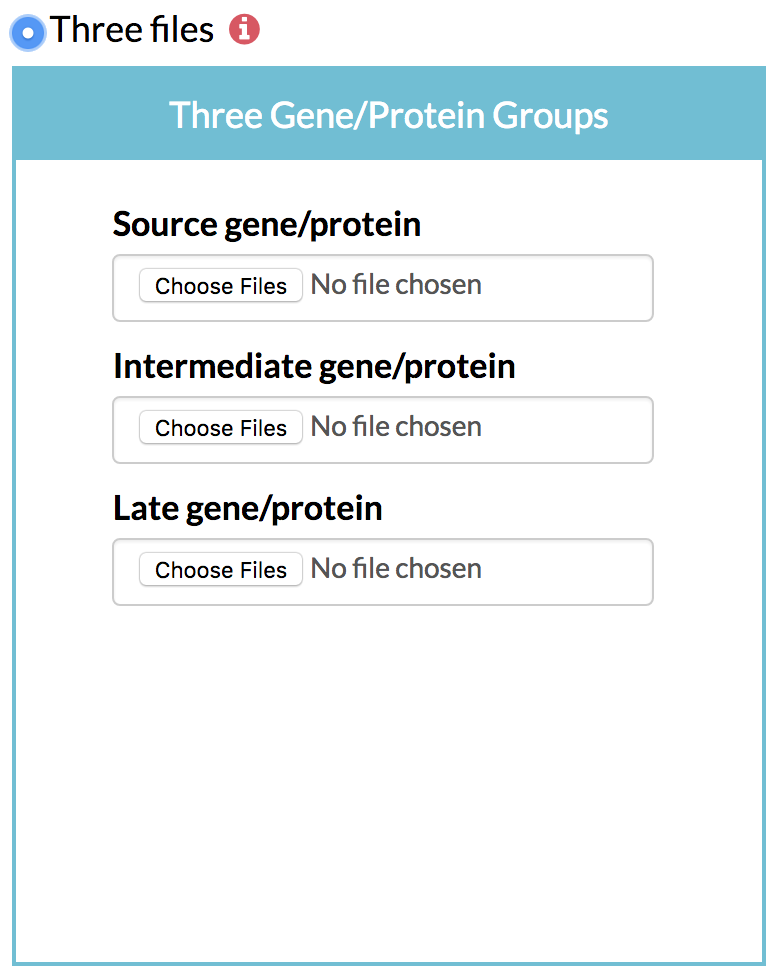
① Source gene list: A list of the genes of interest showing their greatest change in expression, protein content or phosphorylation levels in the early hours after stimulation along with their scores. TimeXNet expects a tab-delimited flat file in the format:
"Molecule[TAB]Score"
Molecule can be an ID or name. The score can be any positive real number that indicates the amount of change in expression of the gene.
② Intermediate gene list: A list of the genes of interest showing their greatest change in values in the intermediate hours after stimulation along with their scores in the format specified above.
③ Late gene list: A list of the genes of interest showing their greatest change in values in the late hours after stimulation along with their scores in the format specified above. The 3 groups of genes can be made based on their expression patterns over time at the user’s discretion.
The genes in each group must be mutually exclusive i.e. each gene can be present in only one group. The group of a gene/protein indicates its time of activation after stimulation. For phosphorylation data, it is recommended that the change in overall phosphorylation of the protein across all sites be calculated at each time point and the first point of change in phosphorylation be considered as the time of protein activation.

C) Single file: A list of the genes of interest showing their greatest change in values in the early, intermediate or late hours after stimulation along with their scores. TimeXNet expects a tab-delimited flat file in the format:
"Molecule[TAB]Score[TAB]Group"
Molecule can be an ID or name. The score can be any positive real number that indicates the amount of change in level of the gene or protein at that particular time. The genes in each group should be mutually exclusive.
5. Network: In order to predict gene networks connecting the genes of interest over time, TimeXNet requires an interaction network containing molecular interactions such as protein-protein, protein-gene interactions or post-translational modifications. The network can be specified in the following formats:
A) Upload a network: The user specifies a list of interactions with their directionality and their reliability score in the format:
"Molecule1[TAB]Molecule2[TAB]Direction[TAB]Reliability"
Molecules 1 and 2 can be an Id or a name in the specified format. The interaction network can use a different type of gene identifier from the gene list. The direction of the interaction can be either "--" (bidirectional interaction) or "->" (uni-directional interaction). The reliability score is between 0 and 1.
B) Protein-protein interaction network taken from HitPredict: The user can also choose to take an available protein-protein interaction network from the HitPredict database. HitPredict is a database of highly curated, experimentally identified protein-protein interactions from multiple species with reliability scores. These networks are currently available for 12 model species.

6. Advanced parameters: Parameters used by TimeXNet to run the flow optimization algorithm.
A) Gamma1: A positive real value that controls the number of Initial genes included in the predicted network. A larger value results in inclusion of more genes from the initial time points.
B) Gamma2: A positive real value that controls the number of Intermediate genes included in the predicted network. A larger value results in inclusion of more genes from the intermediate time points.
7. Email : Giving the user email is optional. However, it is recommended since for large interaction networks, TimeXNet takes approximately 5-7 minutes to run the flow optimization algorithm.

Result
The output of TimeXNet is a temporal response network that maximally connects the early, intermediate and late genes specified by the user in that order within the interaction network. The output network is much smaller than the input network and is enriched in the genes of interest. Additional genes that do not show change in their observed values over time but are important in the functioning of the network are also part of the network as predicted nodes. The interactions (edges) and the genes (nodes) in the network have a flow value. The edge/node flow in the network signifies the importance of that interaction or gene within the network and gives an indication of how many genes of interest it connects to.
On the completion of a run, the user receives an email with the link to the TimeXNet output or is taken to the Results page. The URL of the Results page can be saved and the output can be accessed for 30 days. The Results page contains links to download the predicted gene network and provides ways to visualize and further analyze it.
1. Input: TimeXNet first provides the user with the processed input that it has used to predict the response network. These files are prepared by TimeXNet before running the algorithm and are provided for the convenience of the user.

2. Output: The TimeXNet output can be downloaded in two formats:
A) Tab-delimited files: A file with the predicted network edges and flows is provided for download. A list of genes with their flows is also provided. A type is also specified for each gene to indicate its time of largest fold change as Source, Intermediate or Late. Additionally, “Predicted” genes connecting the above-mentioned three types are also identified.
B) TimeXNet also provides the output network in the SIF Cytoscape format along with annotation files specifying the edge and node flows and the type of nodes or genes. These files can be directly loaded into Cytoscape to visualize the entire predicted network.

3. Network Analysis: The network analysis in TimeXNet allows users to select and visualize networks of genes.
A) Single gene network: The genes identified by TimeXNet as important in the response are shown along with their time of maximum fold change (Source, Intermediate, Late) and their predicted flow. Nodes in the network Images of the gene specific networks can be saved in PNG or JPG format. The networks can be analyzed for enrichment of KEGG pathways and GO Terms.

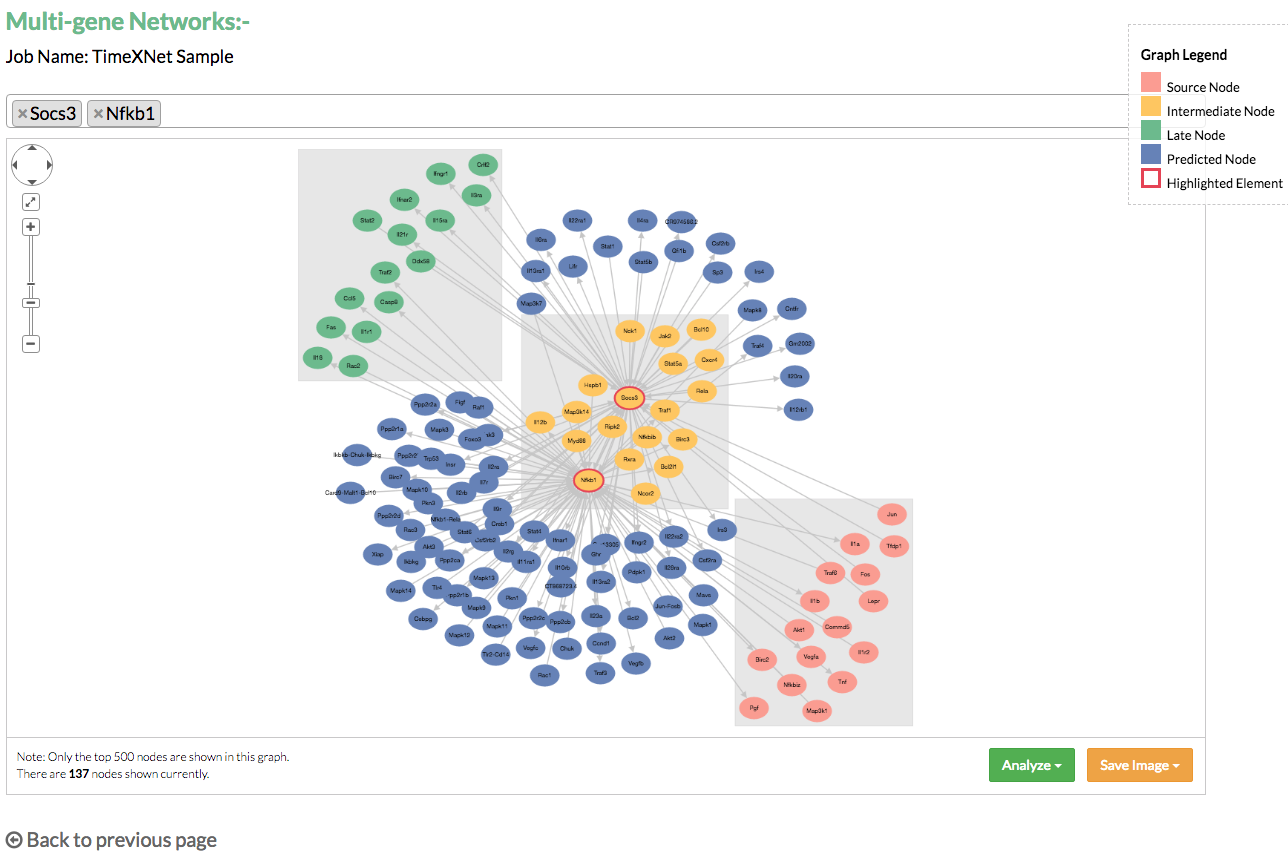
B) Multi-gene networks: Multi-gene networks show the relationships between multiple genes in the predicted networks in the form of their common network connections. The user is allowed to search and select multiple genes and visualize their combined network. This network can also be saved in the PNG and JPG format.
4. Enrichment Analysis: TimeXNet performs functional enrichment analysis on the predicted response network by calling the Gene Ontology enrichment and KEGG pathway enrichment from DAVID, using the input network or the whole genome as the background. All results can be downloaded along with the list of input genes given to DAVID.
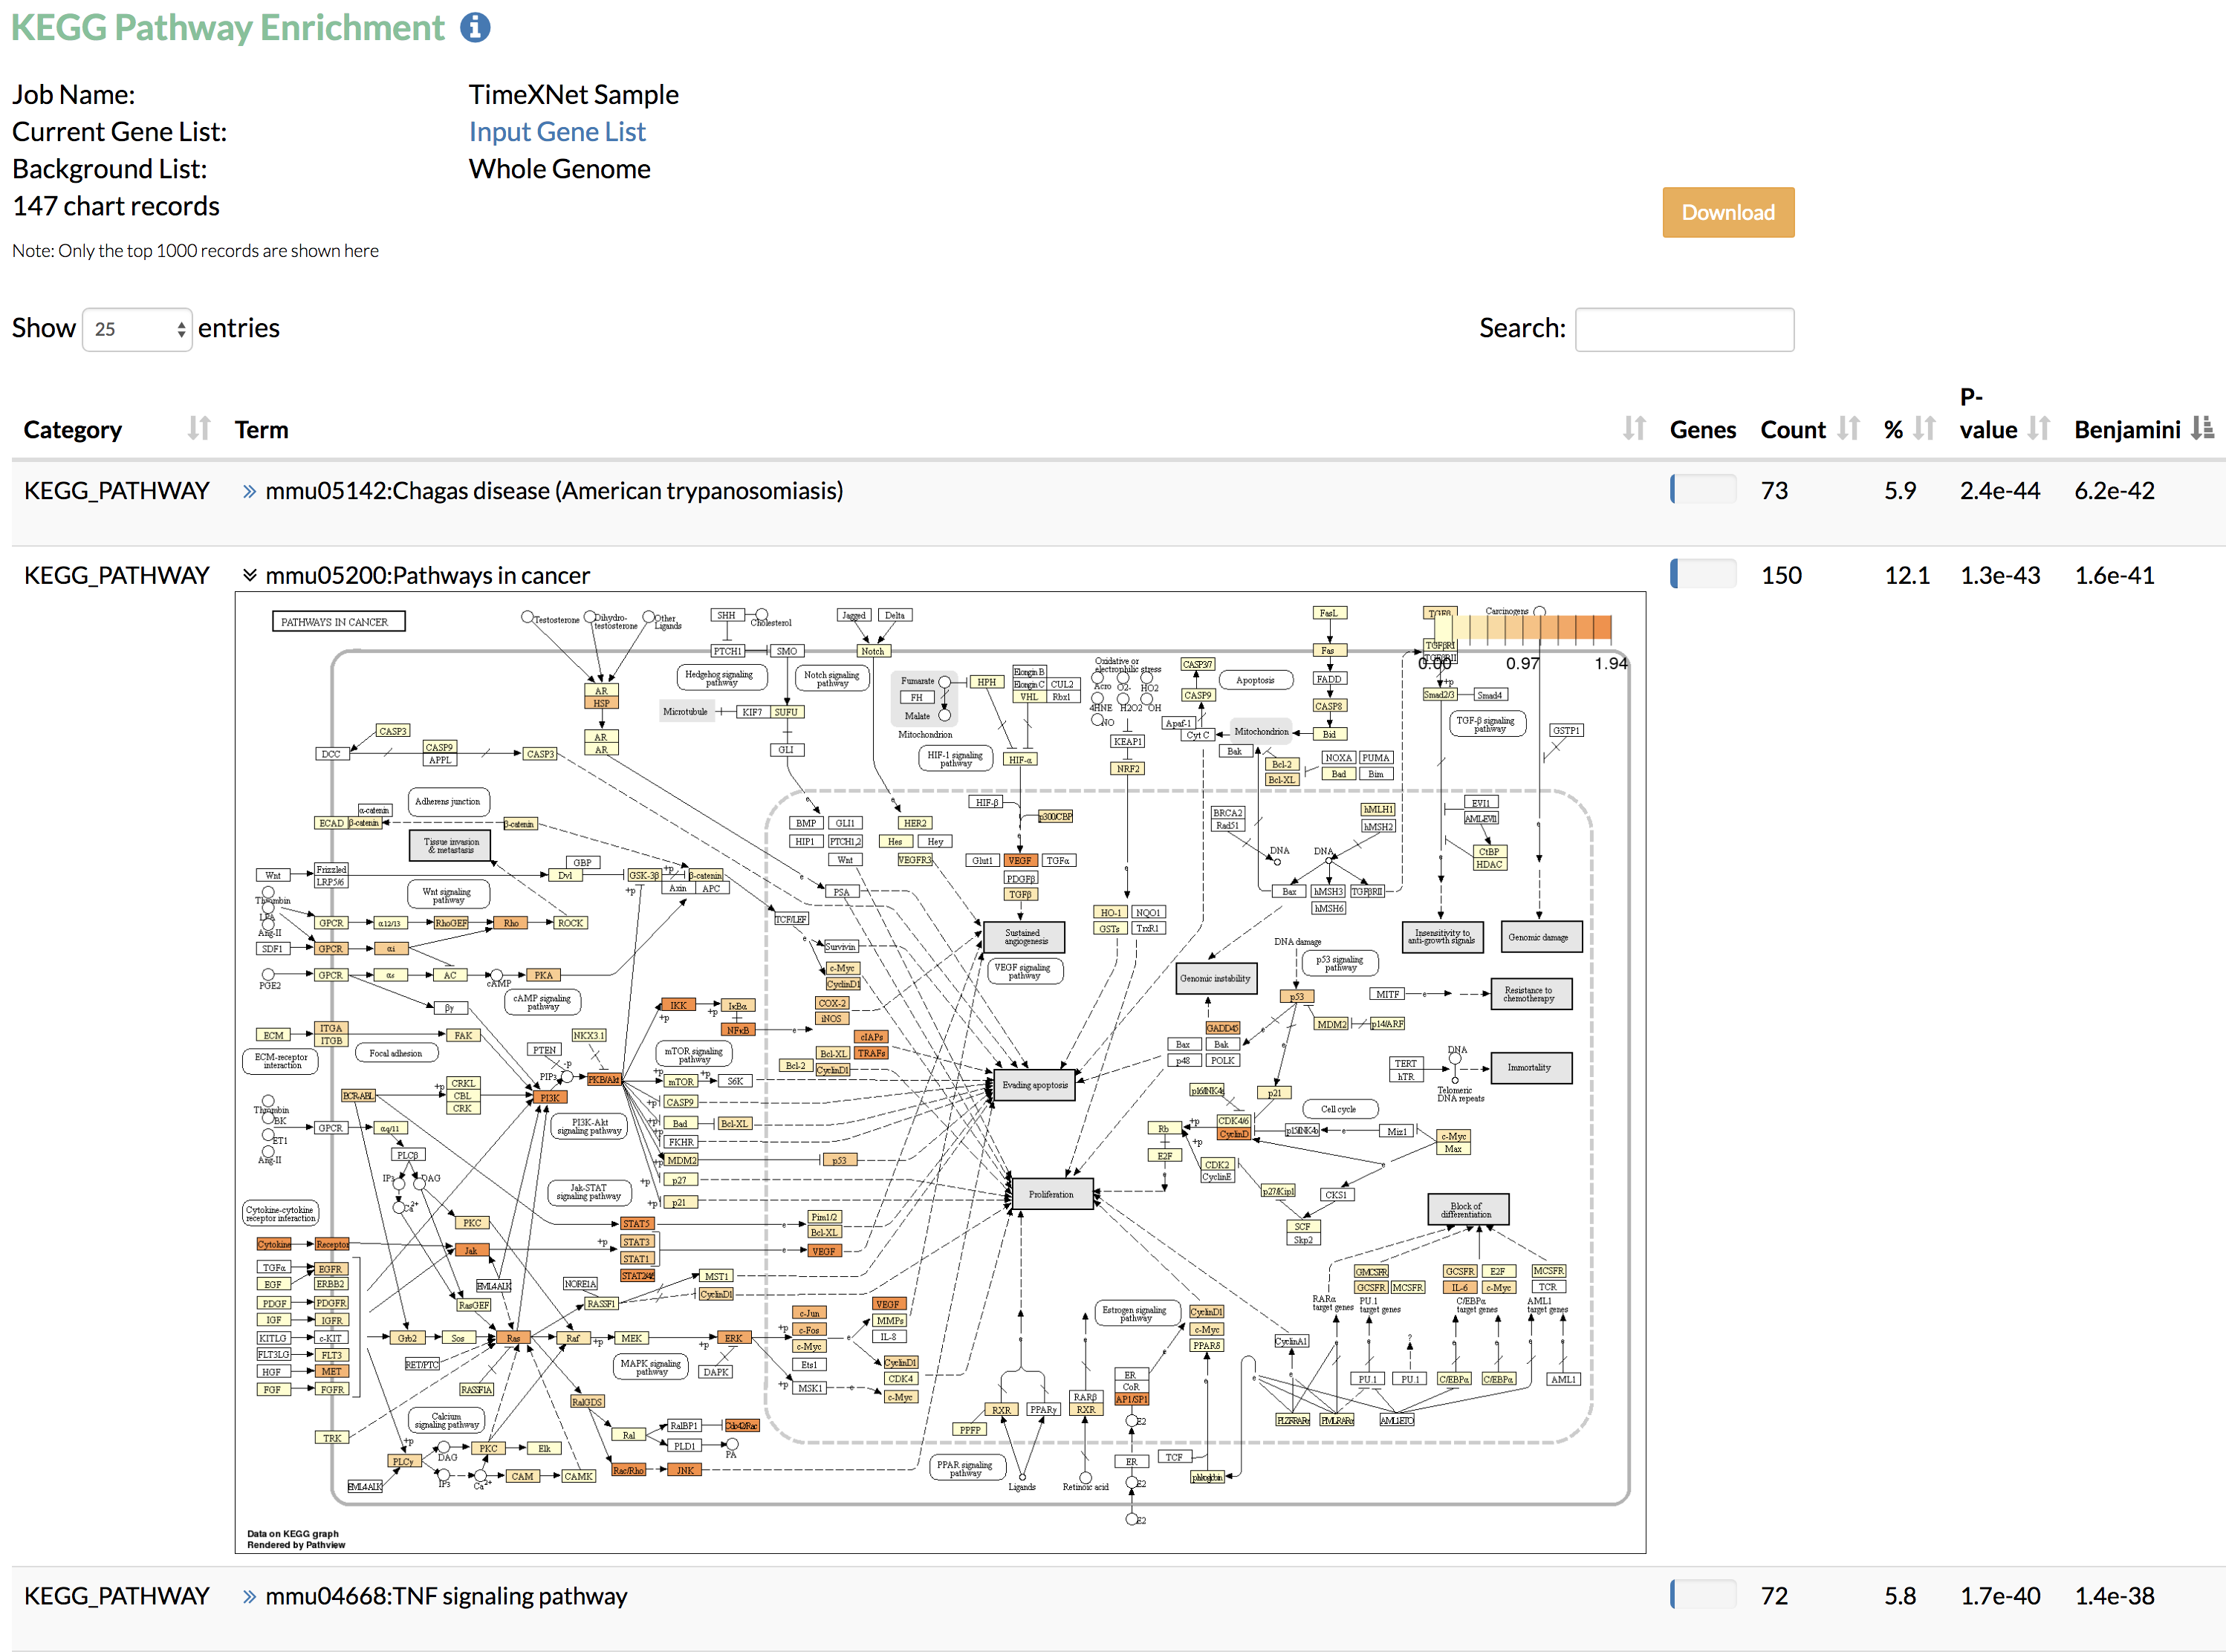
A) KEGG pathway enrichment: Enriched KEGG pathways along with their corrected statistical significance as obtained from DAVID are shown. TimeXNet further displays the KEGG pathway image (generated using Pathview) with genes colored based on the normalized values of the flows predicted by TimeXNet.
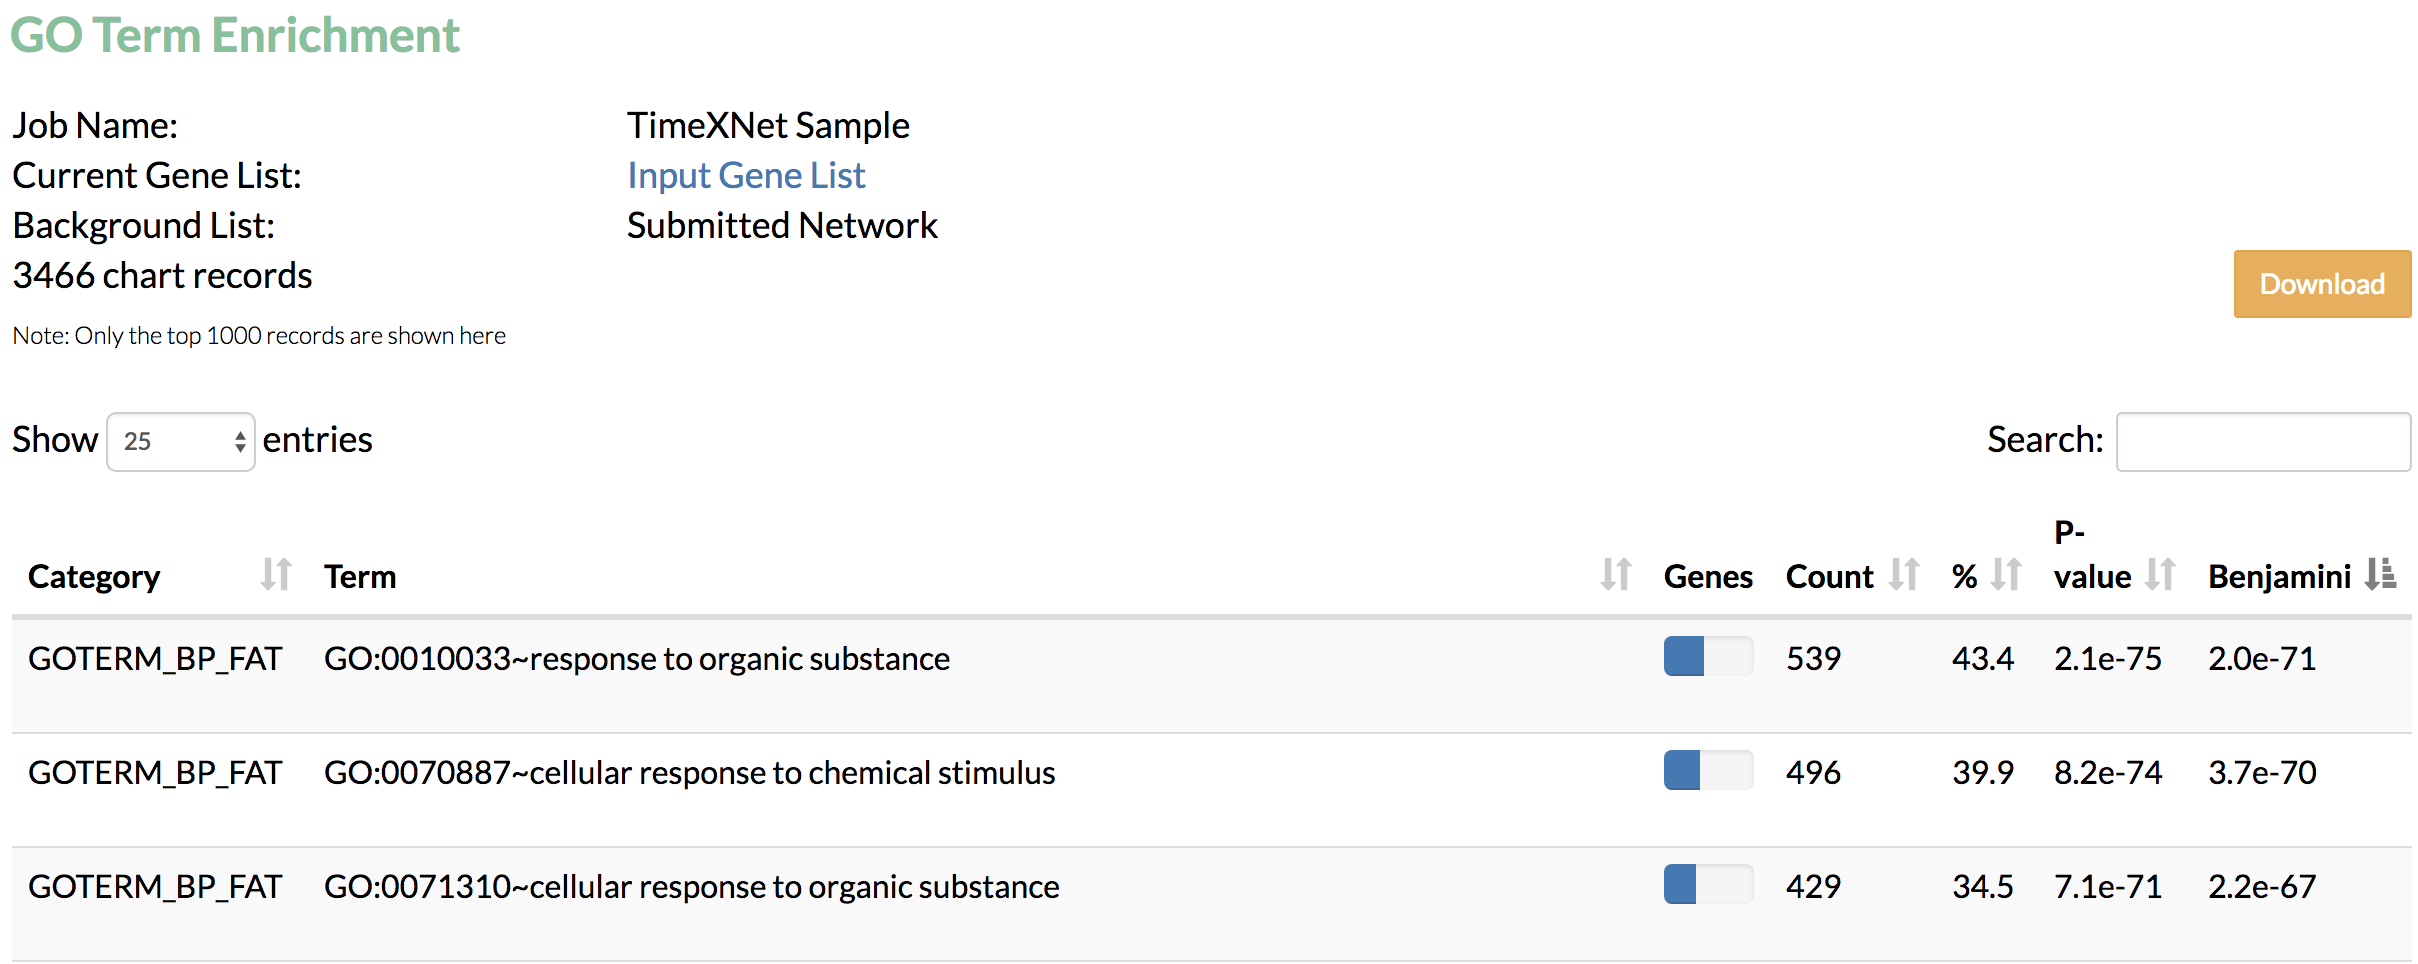
B) GO term enrichment: Gene Ontology terms enriched in the predicted network genes as obtained from DAIVD are displayed.
Example datasets
Seven example datasets on which TimeXNet has been run are provided to the users along with the pre-calculated TimeXNet results and the source publications. These examples highlight the ability of TimeXNet to work with biological data from multiple species and of multiple types.
Java application
TimeXNet is also available for download as a Java application. The application can be run through a user interface and opens the results in Cytoscape. It can also be run from the command line. The download and installation instructions are described here.
References
Cytoscape: a software environment for integrated models of biomolecular interaction networks. Shannon P, Markiel A, Ozier O, Baliga NS, Wang JT, Ramage D, Amin N, Schwikowski B, Ideker T. Genome Research 2003 Nov; 13(11):2498-504.
KEGG: Kyoto Encyclopedia of Genes and Genomes. Kanehisa M, Goto S. Nucleic Acids Res. 2000; 28:27–30.
DAVID-WS: A Stateful Web Service to Facilitate Gene/Protein List Analysis. Jiao X, Sherman BT, Huang DW, Stephens R, Baseler MW, Lane HC, Lempicki RA. Bioinformatics 2012 doi:10.1093/bioinformatics/bts251.
Pathview: an R/Bioconductor package for pathway-based data integration and visualization. Luo W, Brouwer C. Bioinformatics 2013; 29(14):1830-1831. doi:10.1093/bioinformatics/btt285.