Notice: TimeXNet Web will be temporarily affected due to Human Genome Center server maintenance until February 21 (Wednesday) 09:00 JST.
TimeXNet Tutorial
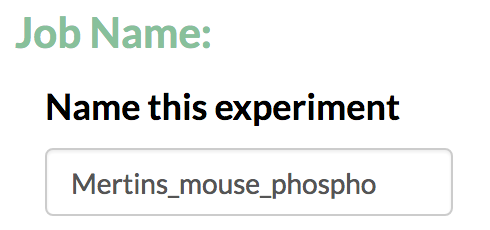
- Enter a name for the analysis run.
- Select the species from the available options based on the genomes in Ensembl.
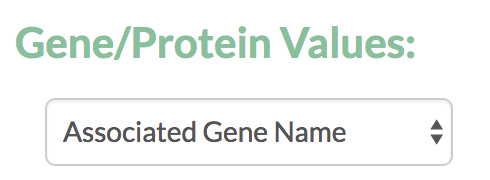
- Select the format of gene/protein values from the available options based on formats supported by UniProt. This identifier format is later used for comparison with the format of input network.
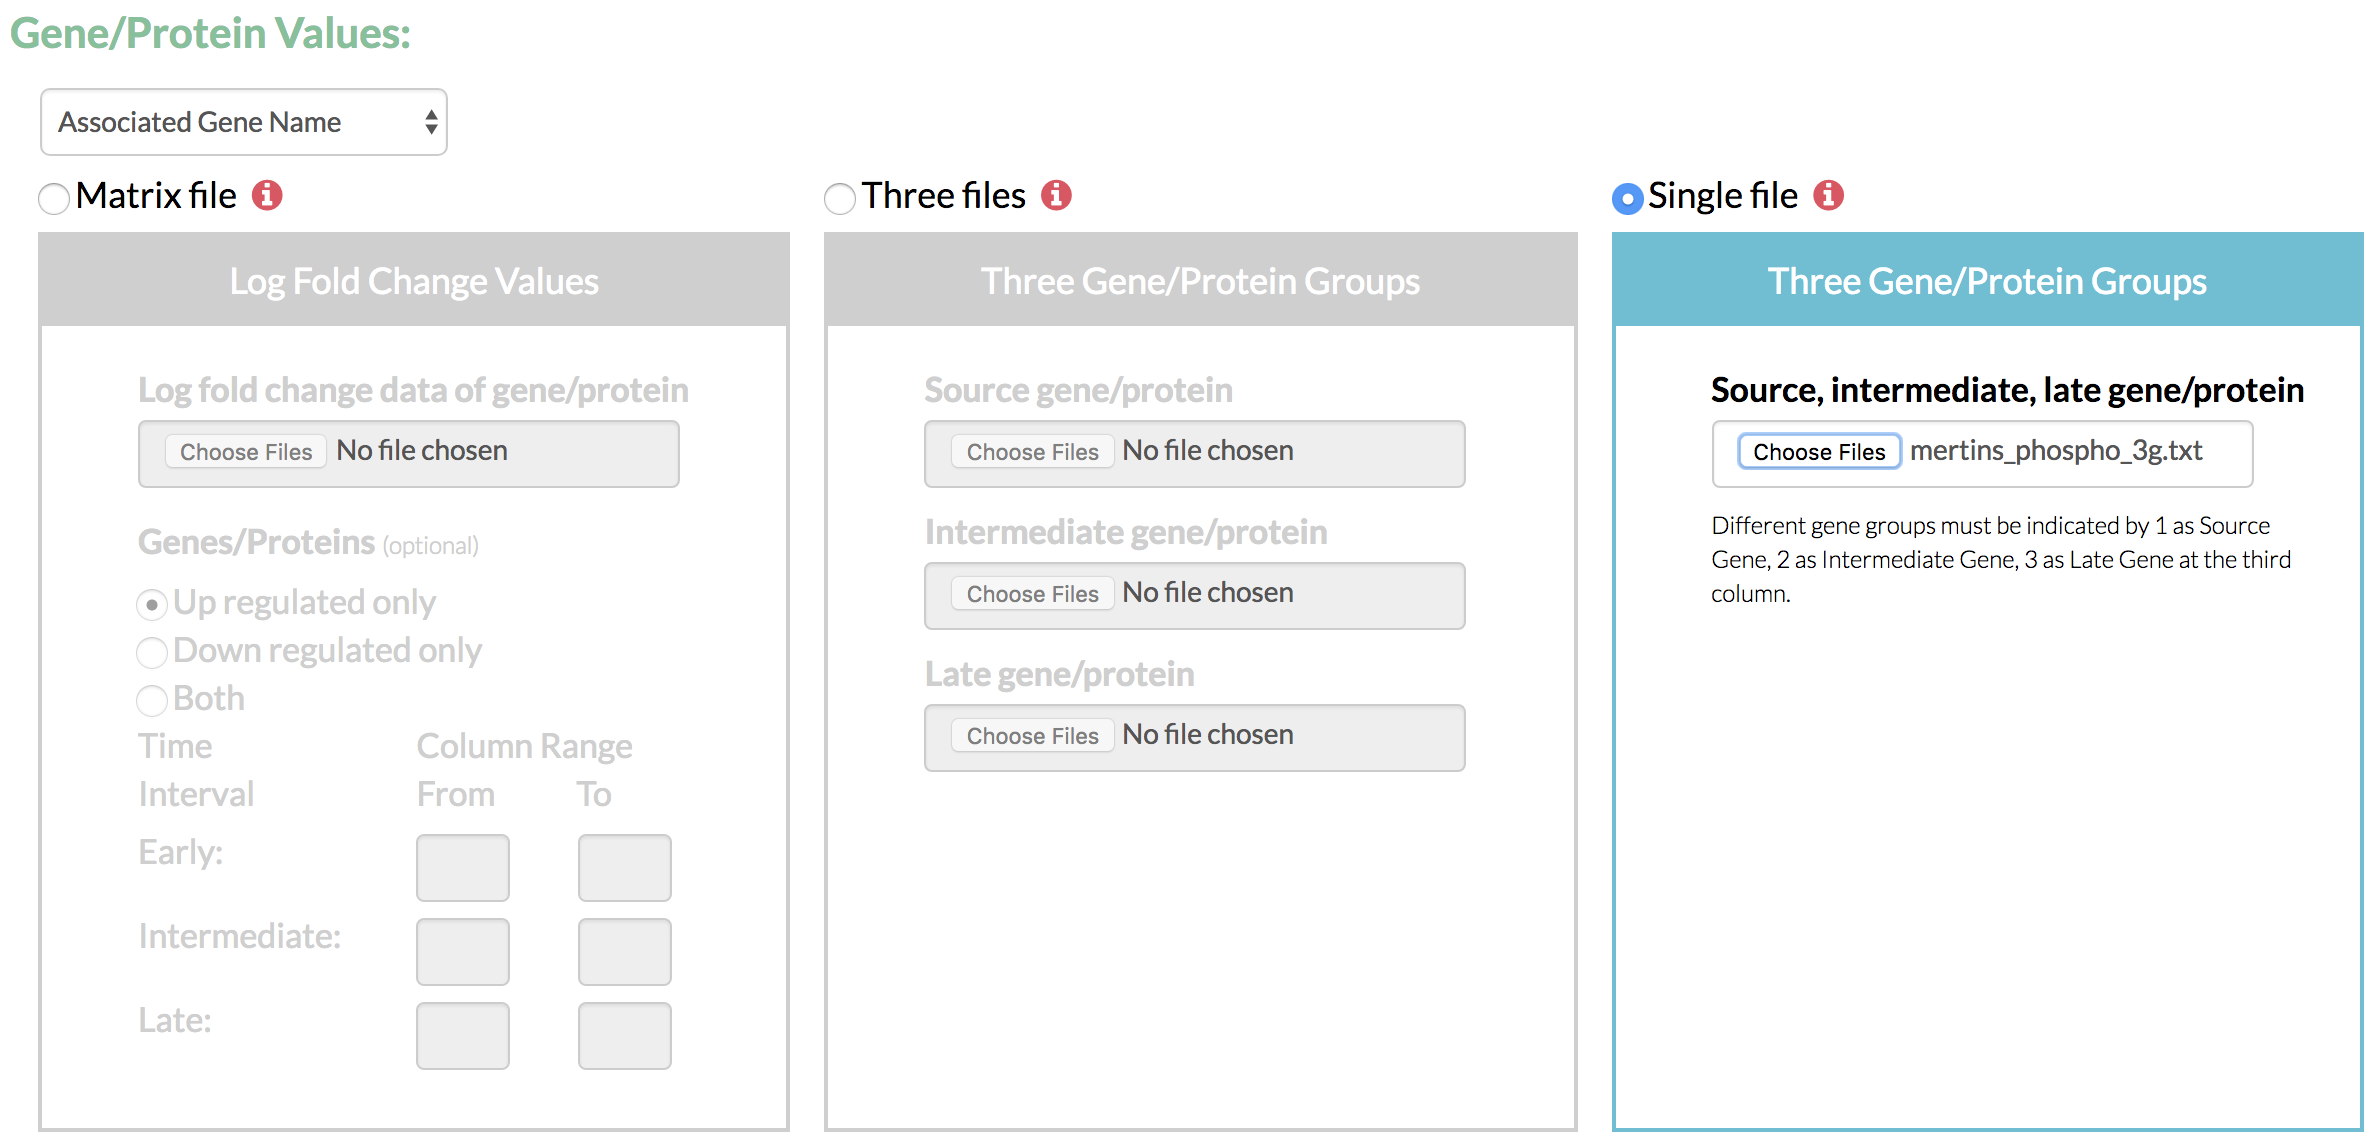
- Specify the time-course fold change data as a matrix of values or as three groups of genes partitioned by their time of highest fold change and scored as per their fold change values.
- If TimeXNet Web is given a matrix of log fold change values over multiple time points, it first classifies the time points into 3 groups – early, intermediate and late. It then assigns each gene/protein to one of the three groups depending on the time at which it shows the highest fold change value. Each gene/protein is also assigned a score as the ratio of its fold change and the average fold change of all gene at all time points.
- The three groups of genes/proteins and their scores can also be directly given to TimeXNet Web as input in a single file specifying groups 1, 2 or 3, or in 3 separate files, one for each group. Each gene must be present only in one group.
- The TimeXNet algorithm requires an interaction network containing at least 50% of the genes from the above-mentioned high-throughput time-course dataset. Specify a format for the genes within the interaction network and upload a list of interactions with weighted edges, or select a network provided by the HitPredict database.
- The user can provide a customized molecular interaction network along with the gene/protein identifier format used. If the identifier format is different from that used in the input gene/protein list, TimeXNet Web converts both the identifier formats to UniProt using the Ensembl BioMart web service.
- The user can also choose to use an in-built protein-protein interaction network provided by HitPredict as input, which is currently available for 12 model organisms. In this case, the user specified identifiers will also be converted to UniProt.
- Enter the parameters used to run the flow optimization that predict the active gene network. These parameters are real positive values that affect the number of early and intermediate genes/proteins that are included in the network. The number of early and intermediate genes/proteins increases with the value of these parameters.
- Enter your email (optional, but recommended so we can send you an email when your results are ready).
- Run TimeXNet!
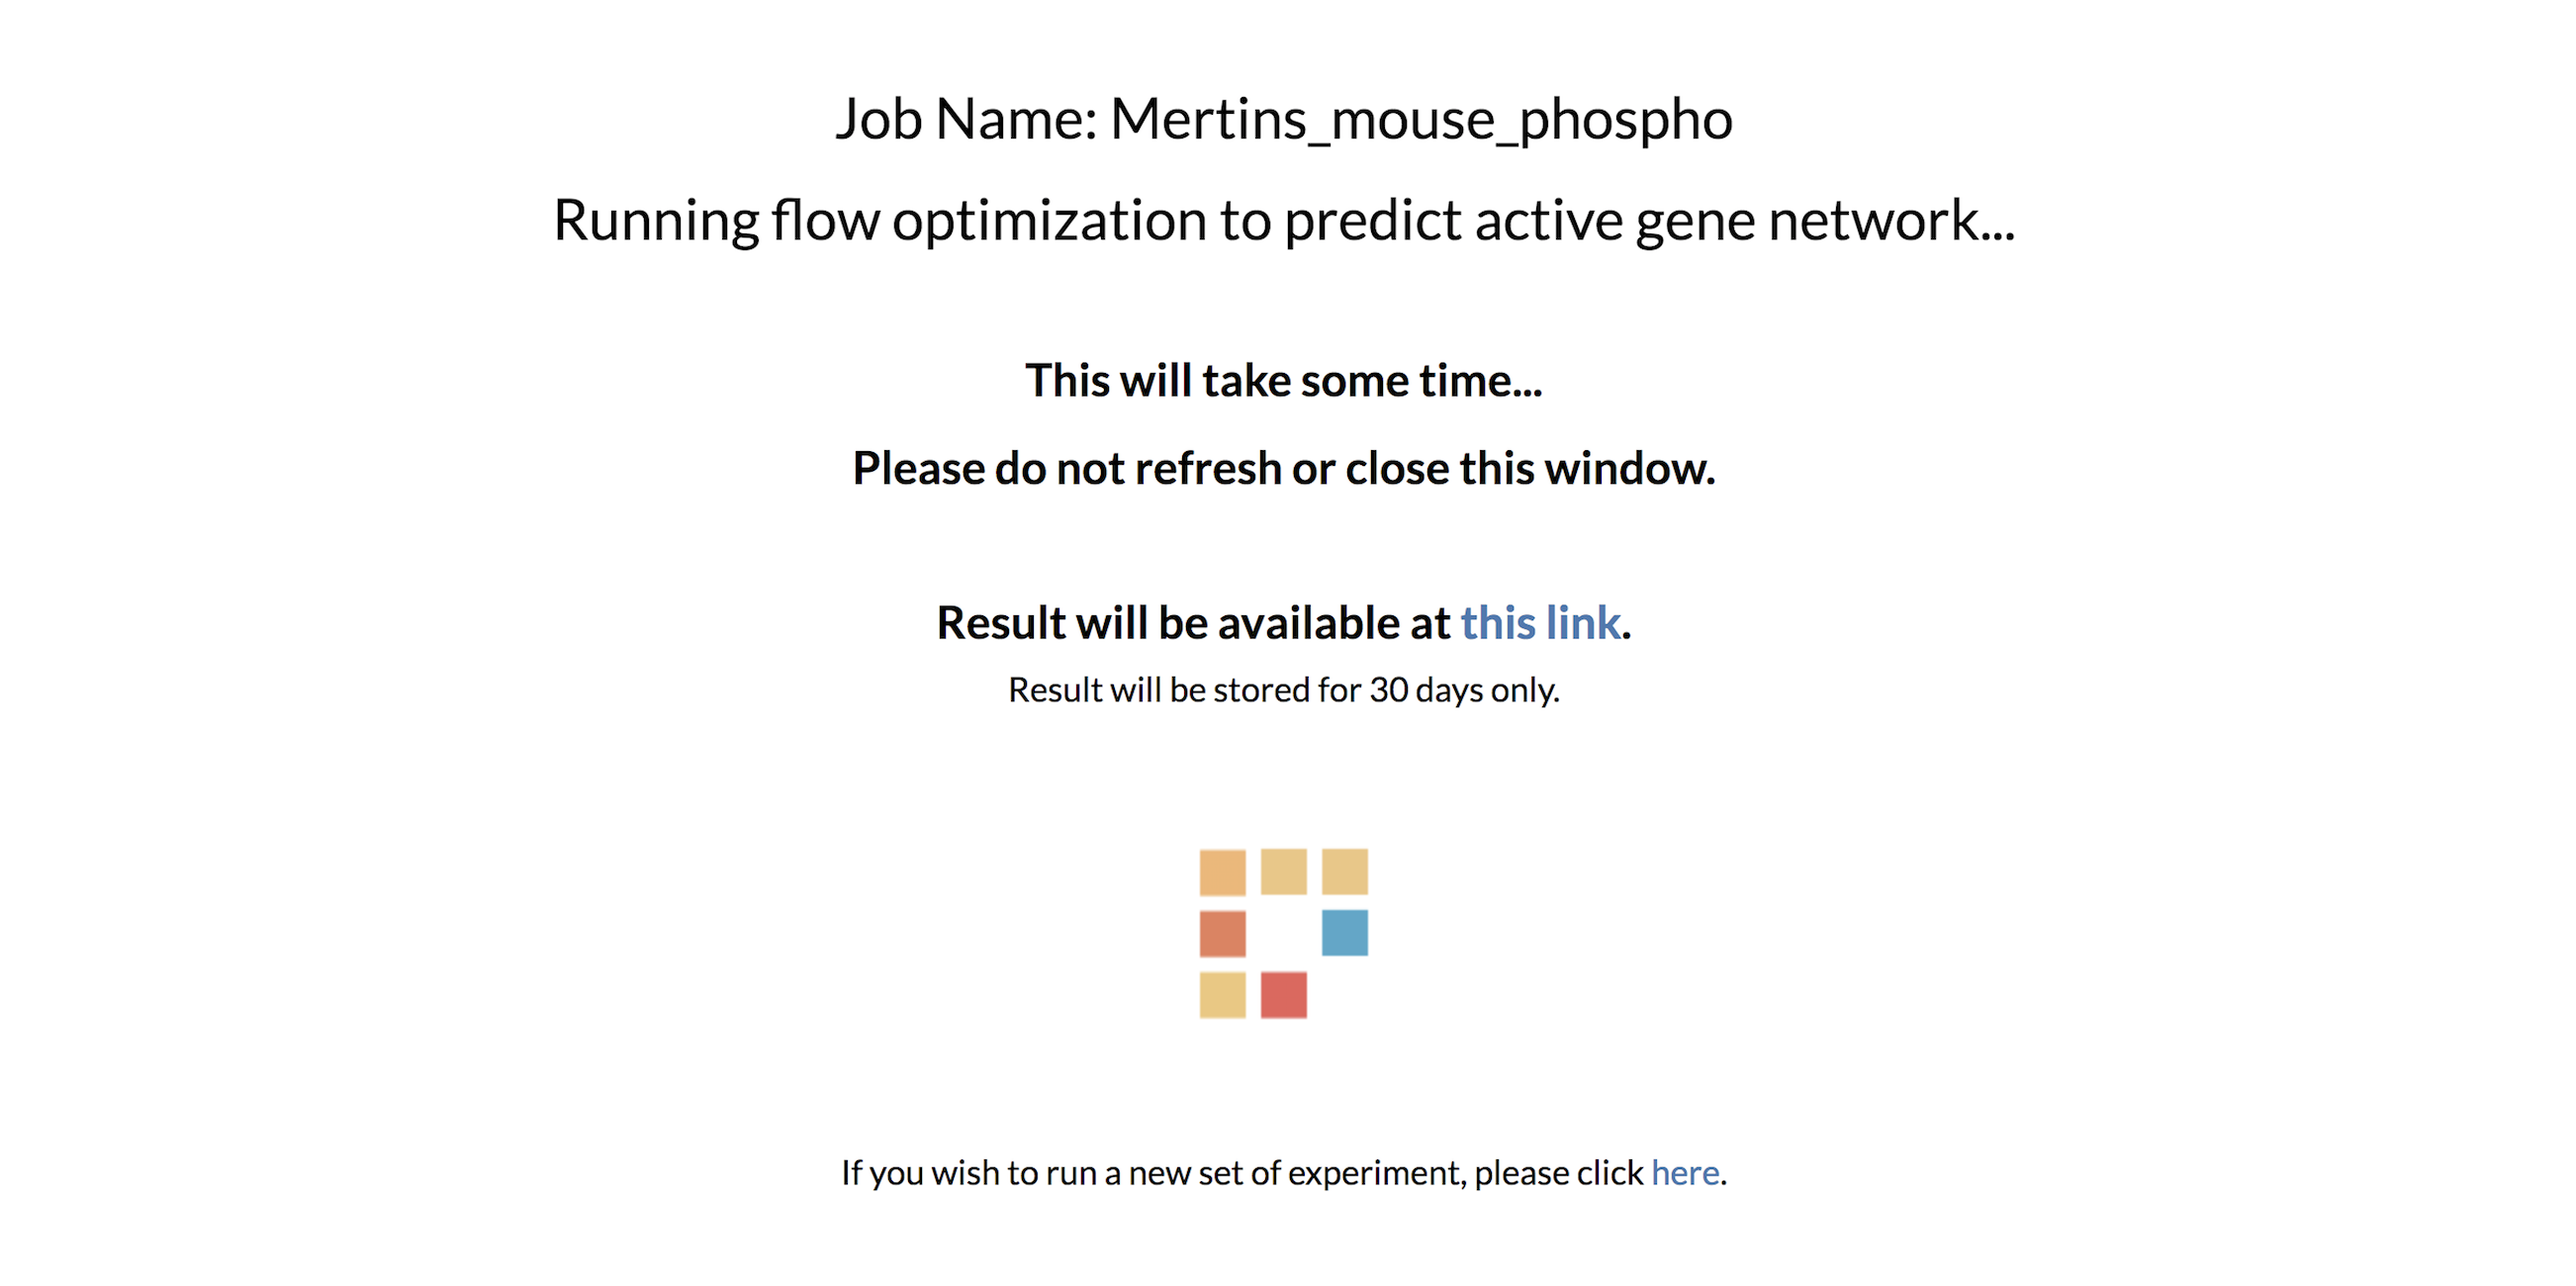
- Wait! TimeXNet runs the minimum cost flow optimization algorithm to find the most reliable interactions connecting the genes showing high fold changes such that genes activated at early time points connect to those activated at intermediate time points, and subsequently to the late effector genes. This problem is solved using linear programming.
On average, TimeXNet Web requires 3-5 minutes to predict one response network from an input network of approximately 130,000 edges and an input list of approximately 1600 genes/proteins. The run-time increases with the size of the input network and the number of input genes. - Done! Let’s take a look at the results. Confirm the input values.
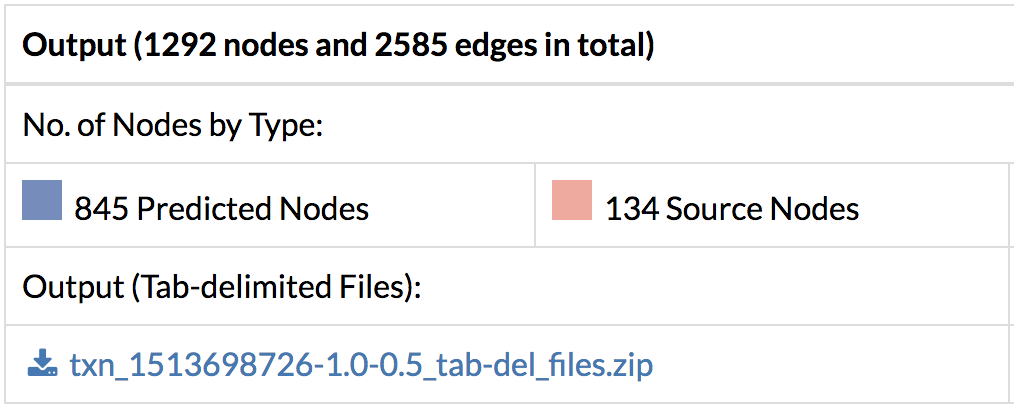
- Download the output files with the predicted response network containing interactions and their flows, and nodes and their flows. Flows correspond to scores within the predicted network and a higher flow indicates more connectivity with other genes of interest.
- Save the entire network in Cytoscape format along with the edge and node annotation files. Load them directly into Cytoscape and see the full network.
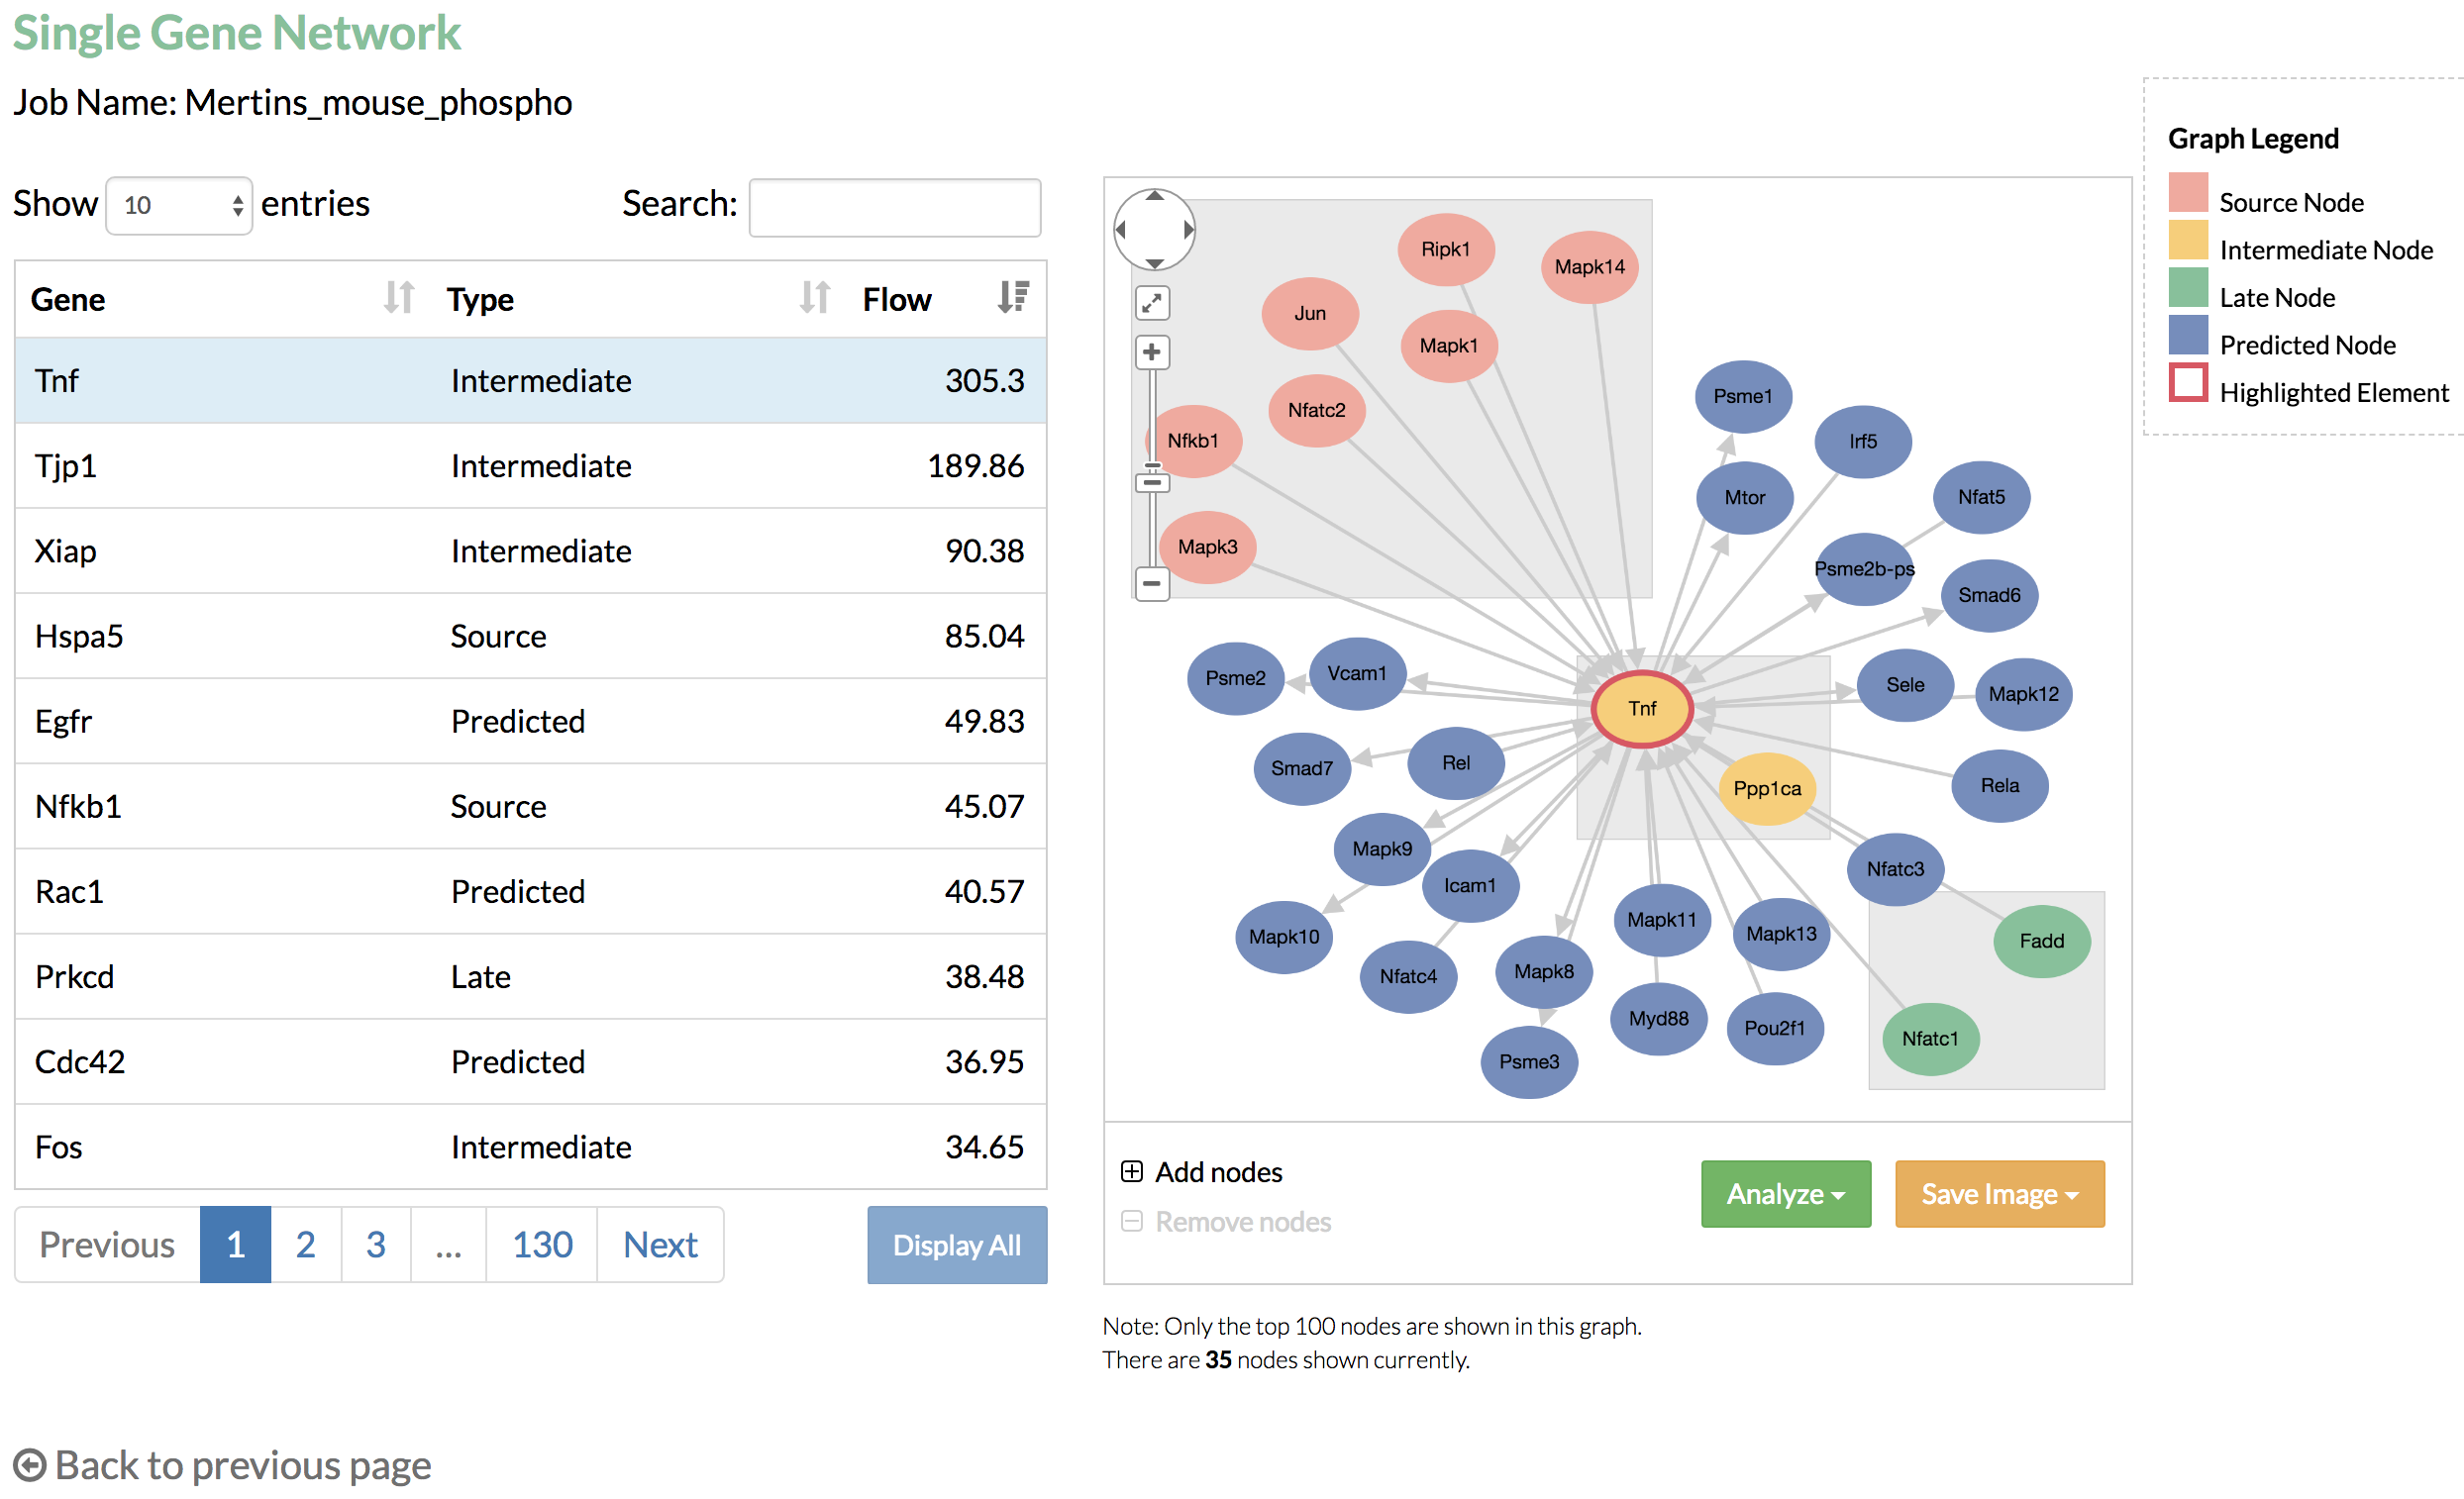
- Look at the genes selected by TimeXNet and their associated network. Which genes have the highest flows? Which are the predicted genes connecting the genes with high fold changes? Search for a particular gene to see its network and connections.
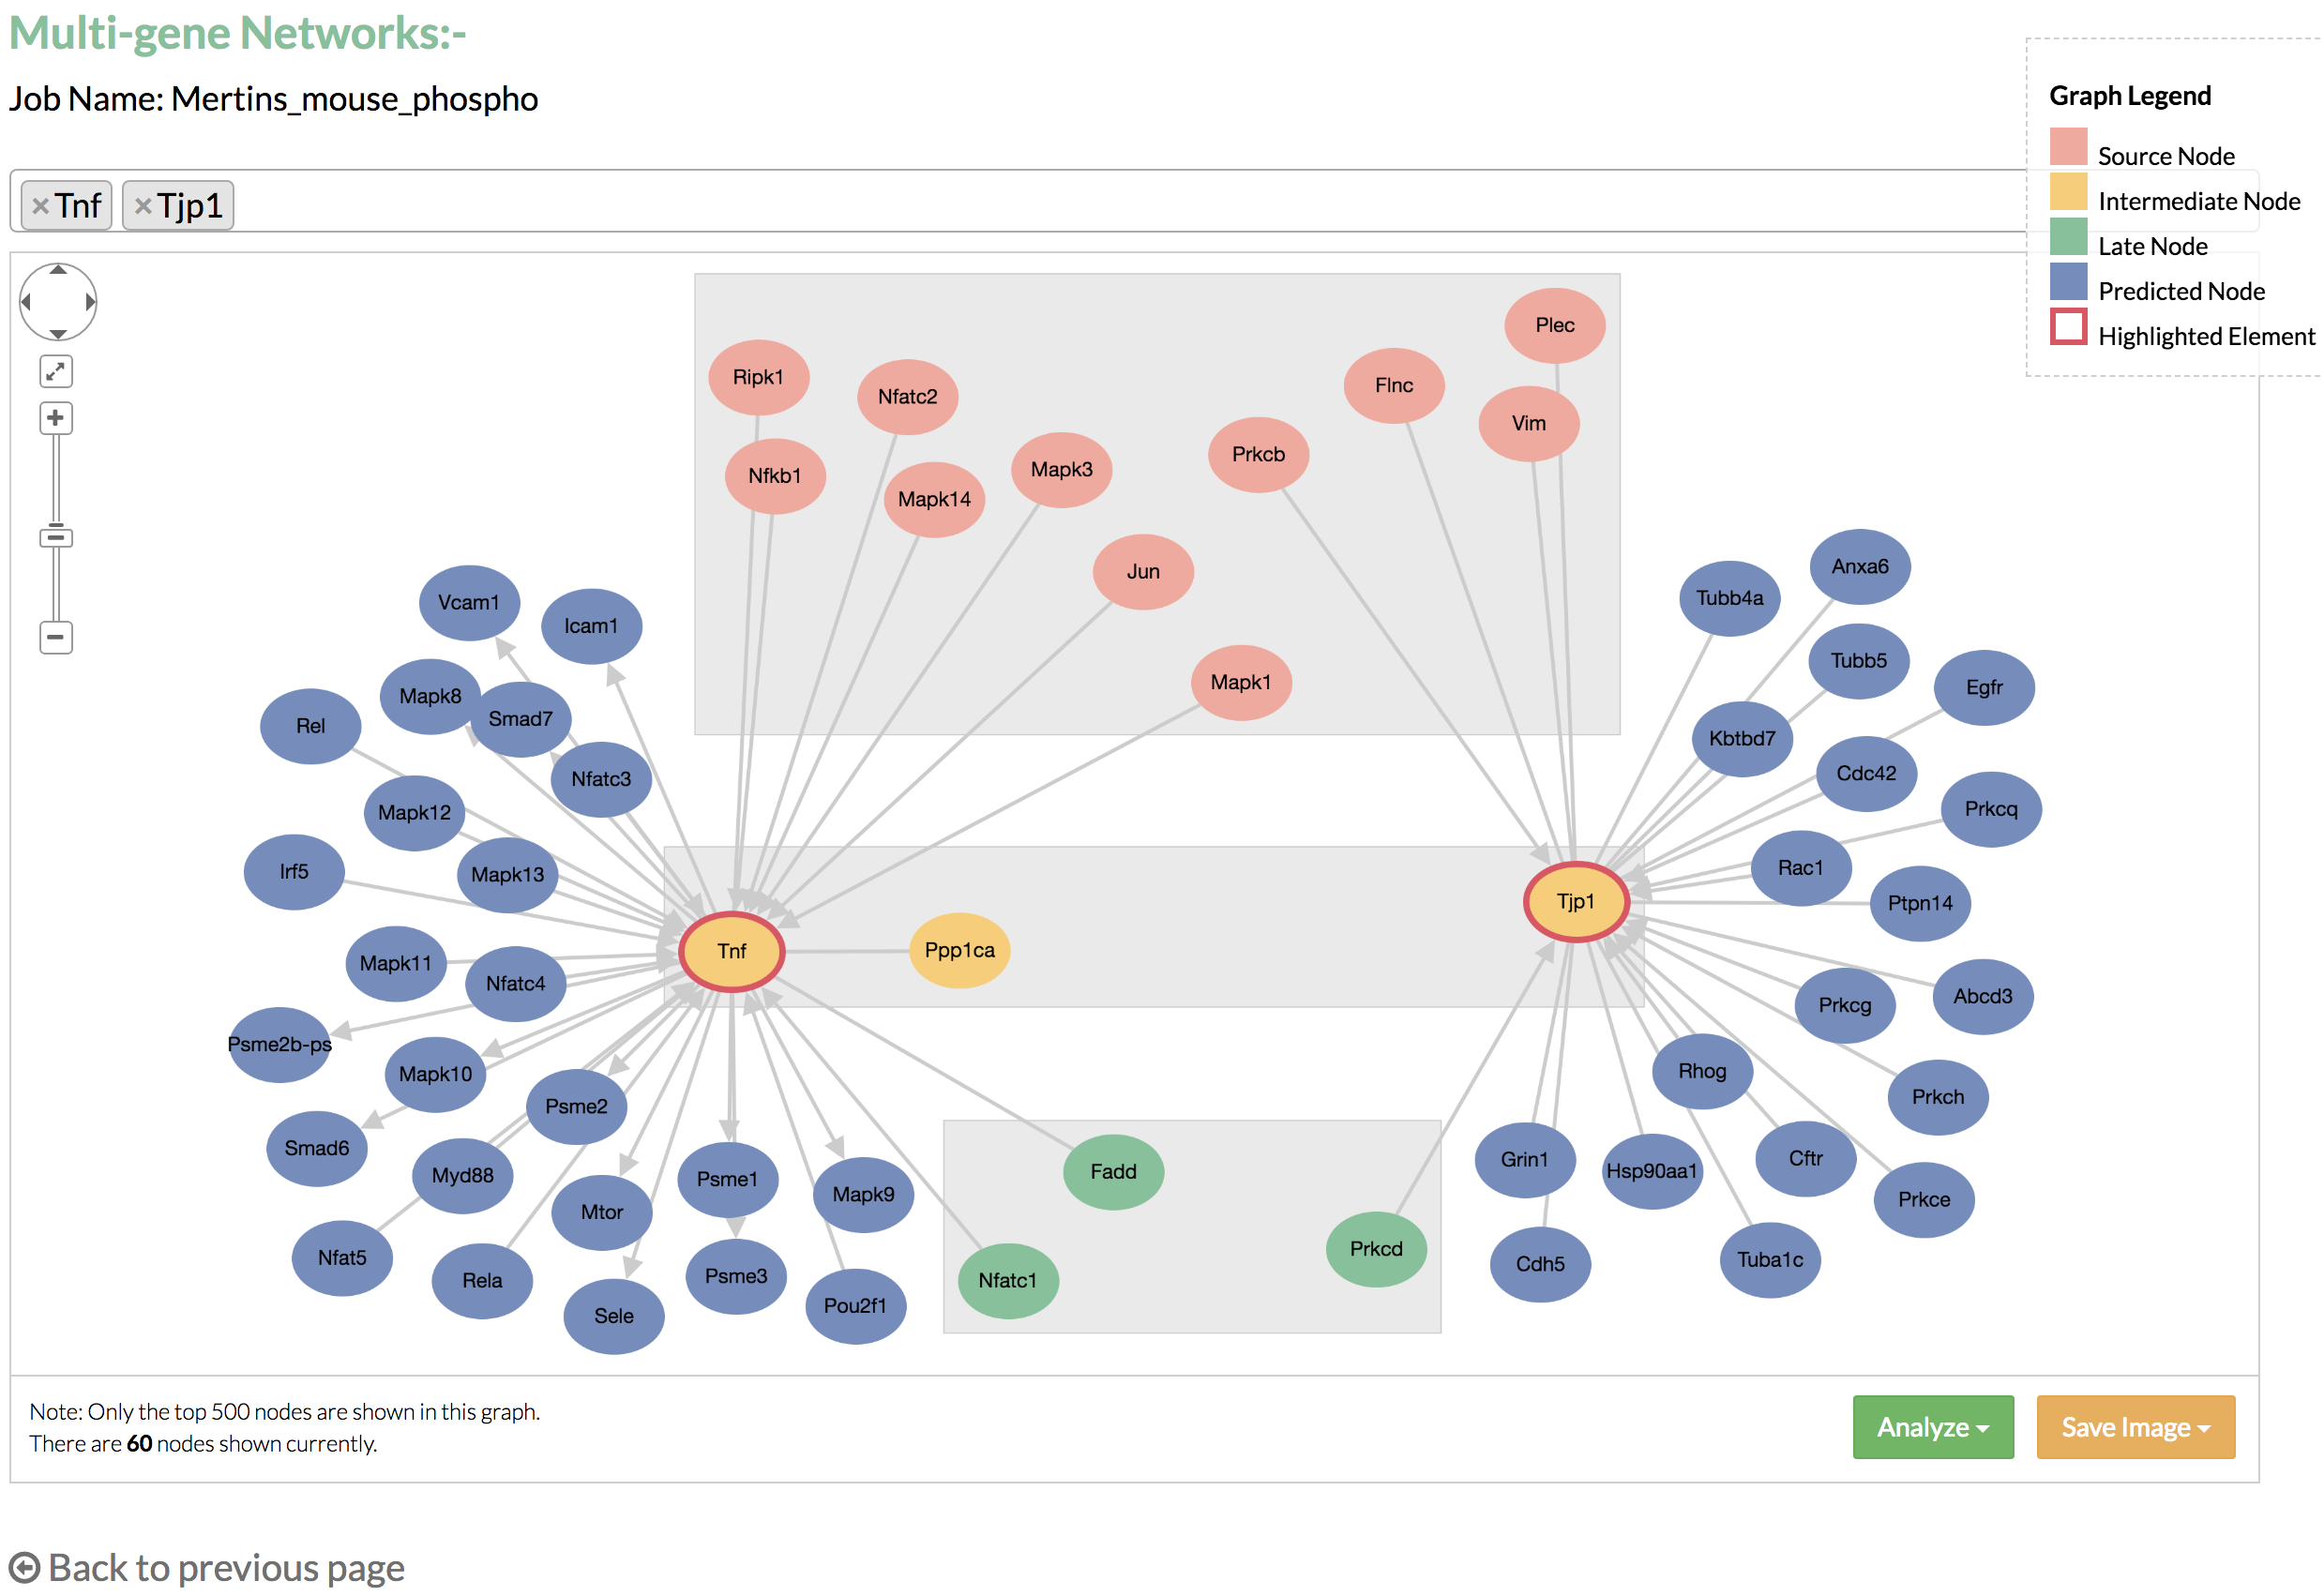
- Take a look at the gene network. Genes are grouped by their time of fold change and shown in different colors. The genes predicted to be functionally important are shown in blue. You can increase the number of nodes in the network and save the network image for later use.
- Single gene network: the table on the left lists all the genes from the predicted network, and the graph on the right shows the nodes that connect to the selected gene from the table.
Single gene network can show a maximum of 100 nodes in the graph. If the node limit is not reached, you may click "Add nodes" to display additional nodes, which are linked to the nodes that connect to the selected gene. - Multi-gene networks: the graph shows the nodes that connect to the genes listed in the select box.
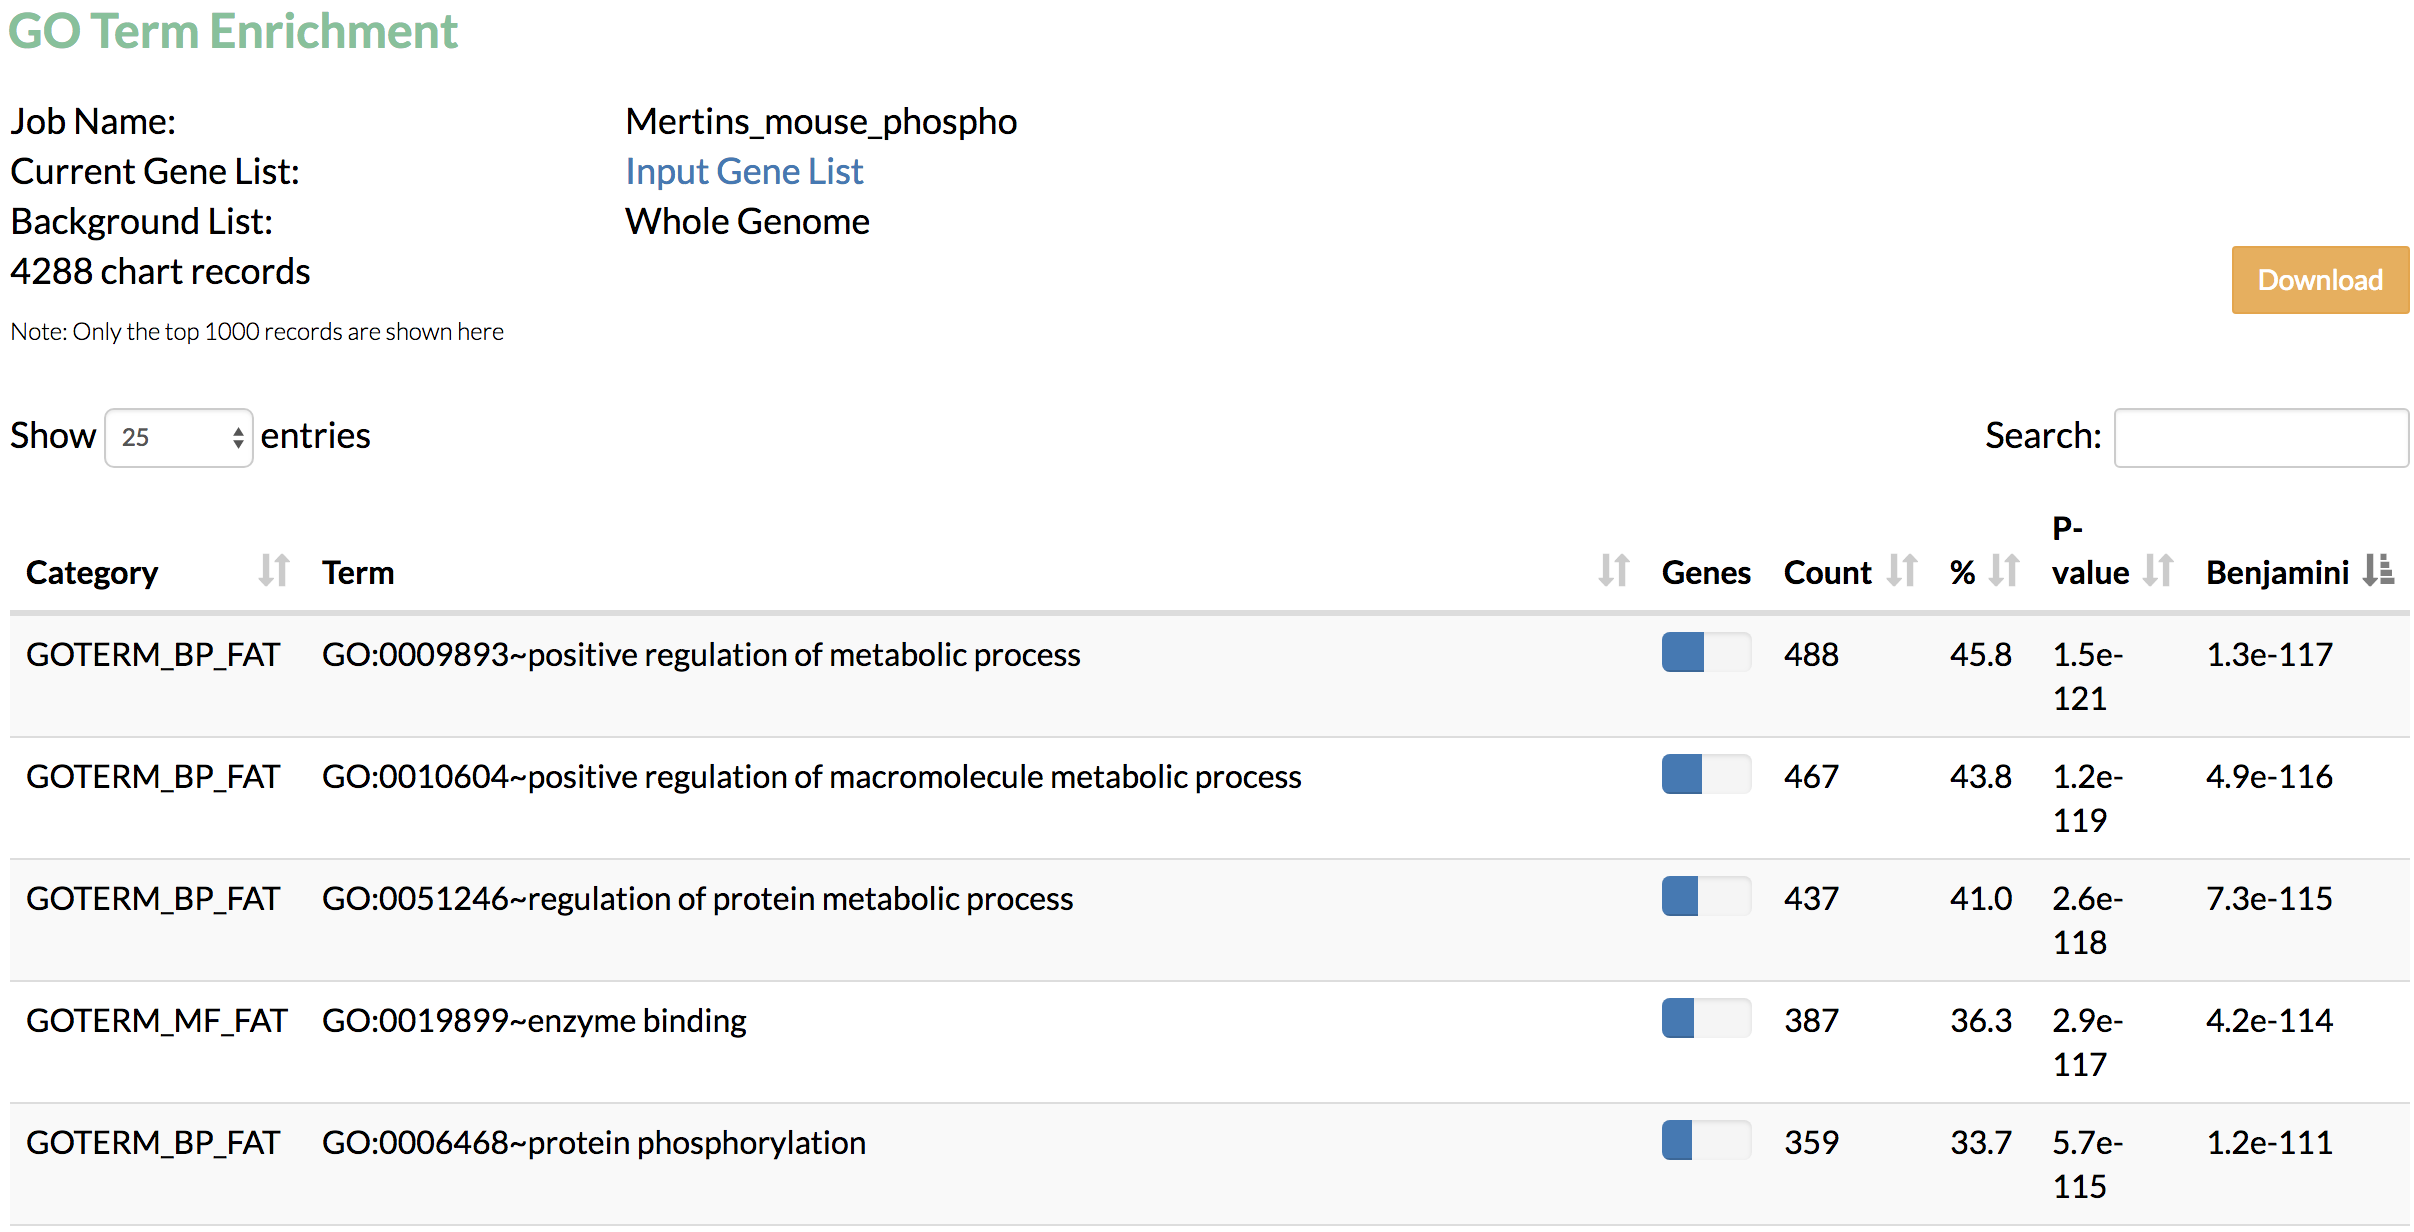
By default, the top two genes with the highest flows from the predicted network are selected. You may add more genes by typing the name of the gene in the select box. You may also remove an unwanted node by clicking the 'x' on the left of the displayed gene. Multi gene network can show a maximum of 500 nodes in the graph. - Perform functional enrichment analysis using DAVID from the links on the Results page or the “Analyze” button on the gene network.
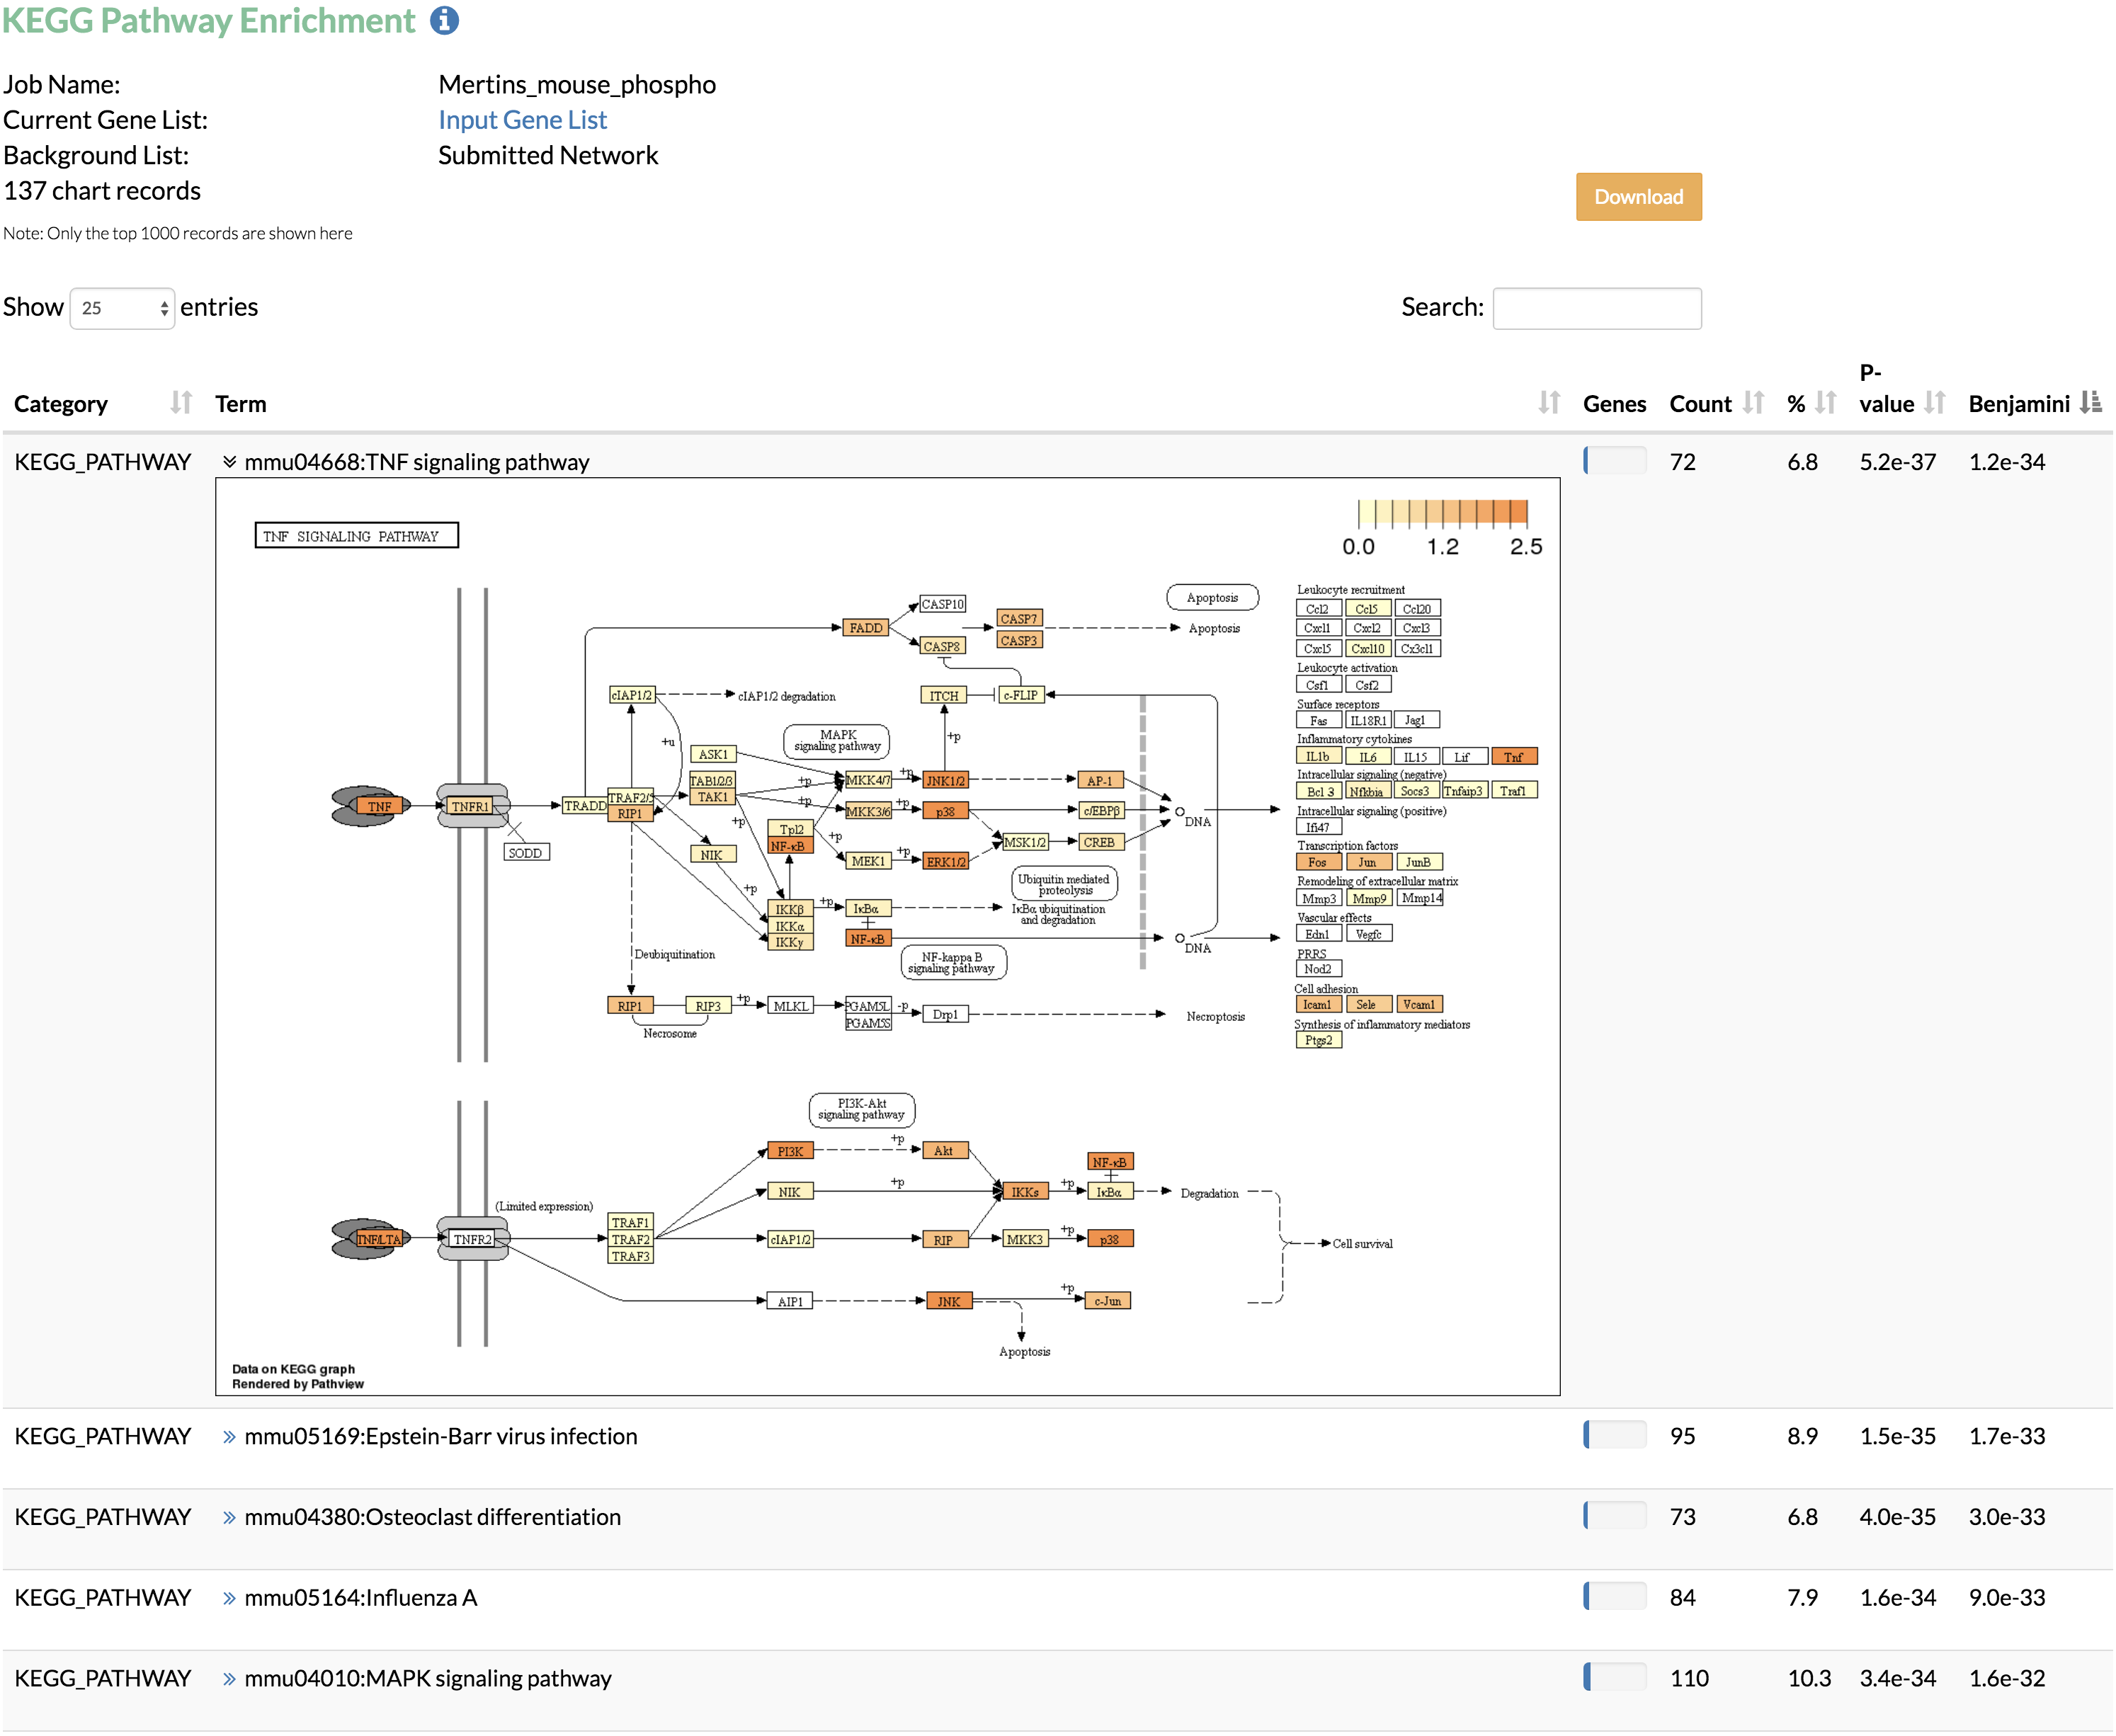
The enrichment analysis can be performed using the input network or the whole genome as the background. In networks that require conversion from gene names or Ensembl Protein IDs to UniProt IDs, TimeXNet Web may be slow due to the excess time required for format conversion, since the DAVID web service does not allow these two formats as input. Additionally, our testing shows that the DAIVD web service requires a longer time to return enrichment analysis results when a background gene list is provided. - Run KEGG pathway enrichment to visualize the genes predicted by TimeXNet in KEGG pathways. Genes are colored by their normalized flows predicted by TimeXNet. Visualization is done using Pathview. The pathway graph may take some time to generate.
- Run Gene Ontology term enrichment analysis to find the functional terms enriched in genes identified by TimeXNet.








References
Cytoscape: a software environment for integrated models of biomolecular interaction networks. Shannon P, Markiel A, Ozier O, Baliga NS, Wang JT, Ramage D, Amin N, Schwikowski B, Ideker T. Genome Research 2003 Nov; 13(11):2498-504.
KEGG: Kyoto Encyclopedia of Genes and Genomes. Kanehisa M, Goto S. Nucleic Acids Res. 2000; 28:27–30.
DAVID-WS: A Stateful Web Service to Facilitate Gene/Protein List Analysis. Jiao X, Sherman BT, Huang DW, Stephens R, Baseler MW, Lane HC, Lempicki RA. Bioinformatics 2012 doi:10.1093/bioinformatics/bts251.
Pathview: an R/Bioconductor package for pathway-based data integration and visualization. Luo W, Brouwer C. Bioinformatics 2013; 29(14):1830-1831. doi:10.1093/bioinformatics/btt285.